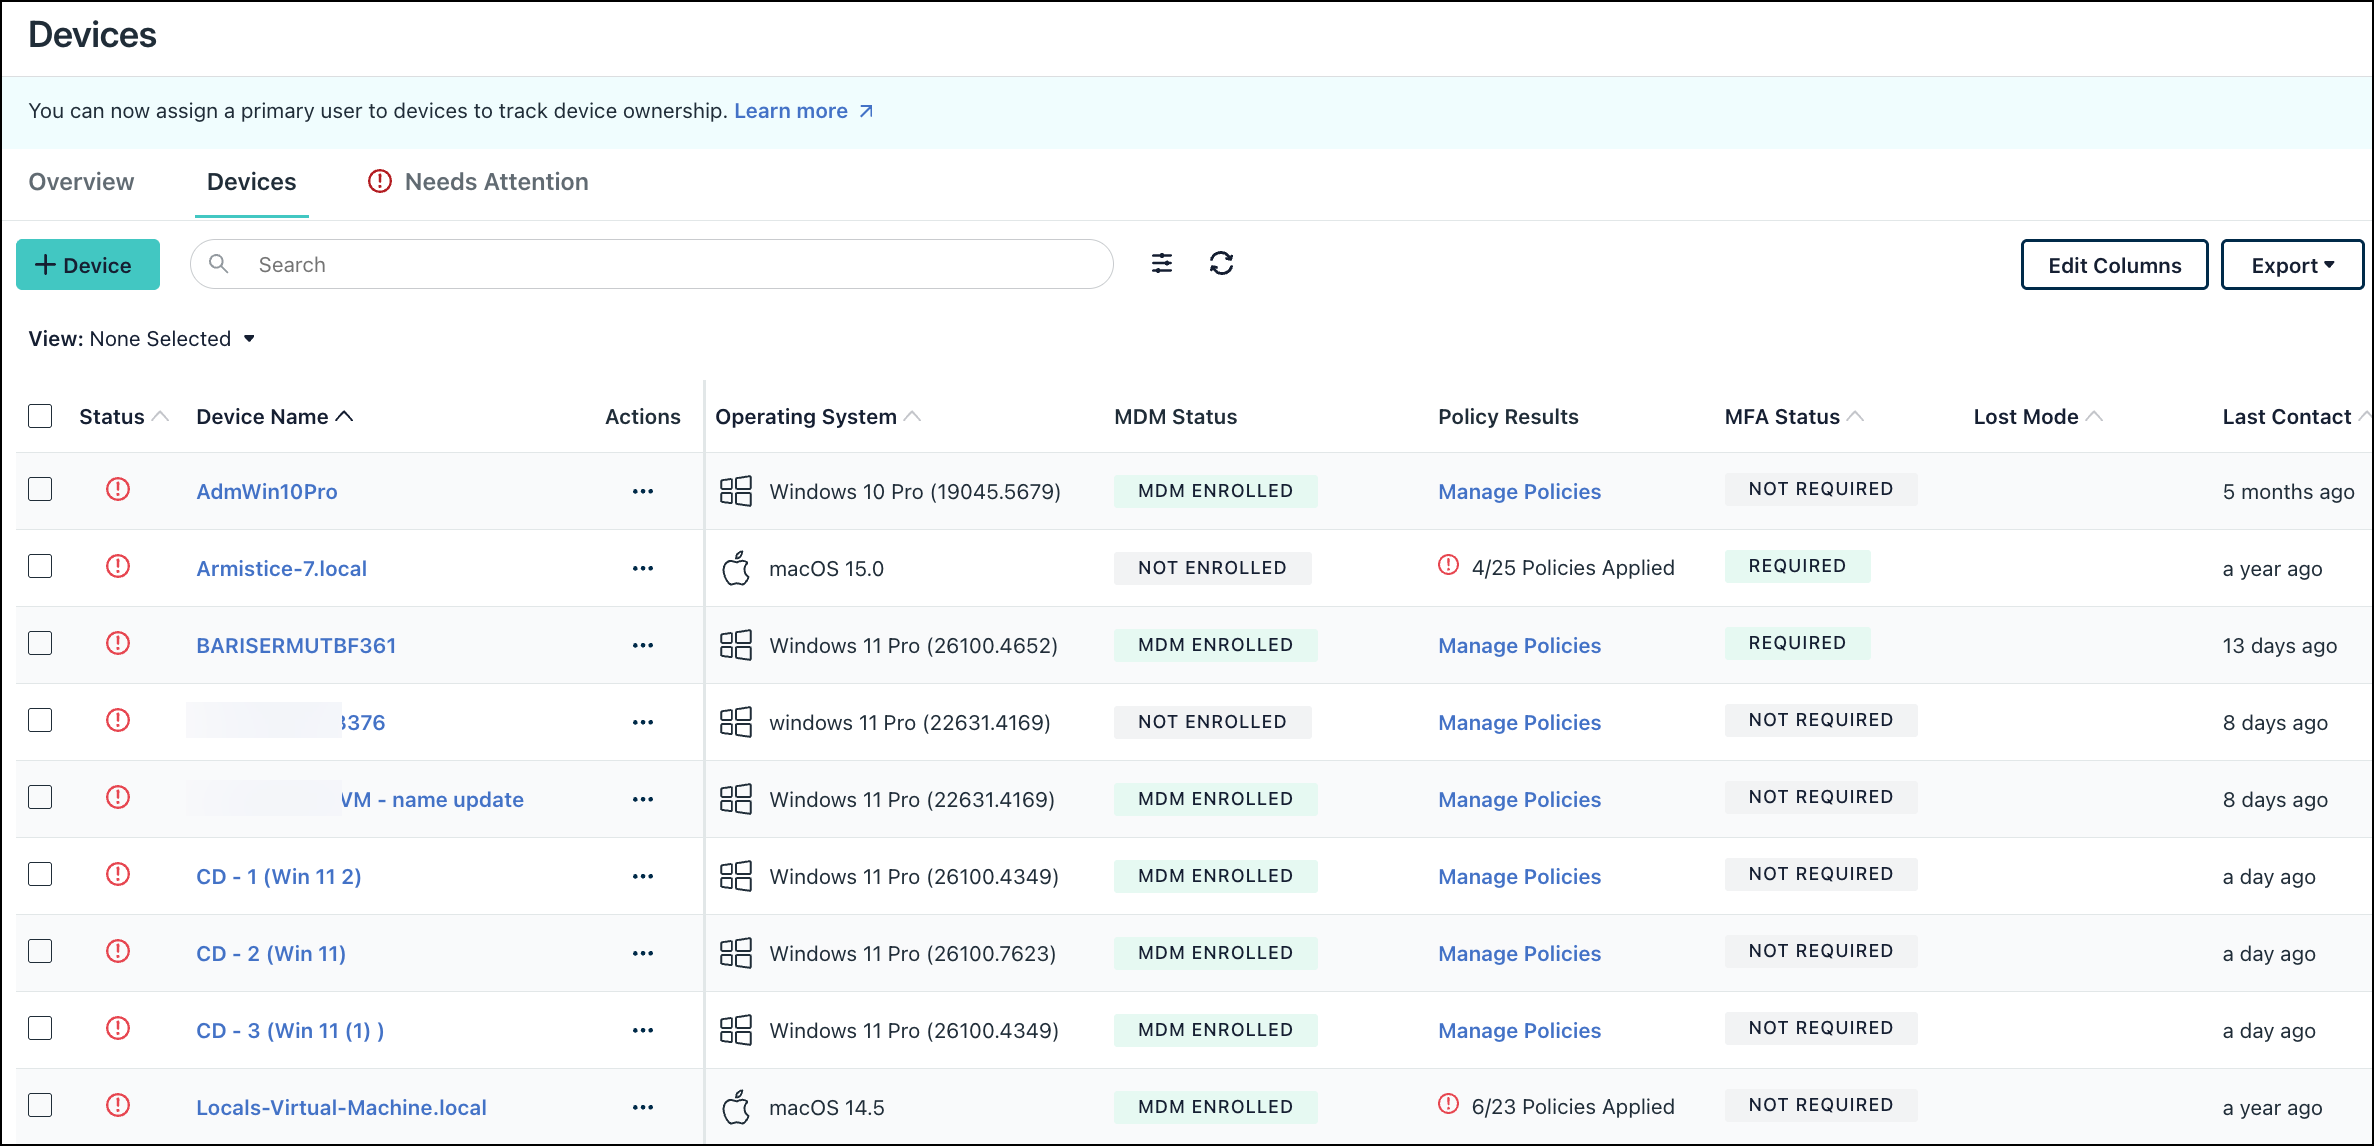
Jumpcloud users can apply several policies to enrolled devices. You can view the results of the policies applied to an enrolled device from the Devices page.
Viewing Policy Results on Device Page
To view the policy results in the Admin Portal:
- Log in to the JumpCloud Admin Portal.
Important:
If your data is stored outside of the US, check which login URL you should be using depending on your region, see JumpCloud Data Centers to learn more.
- Go to Device Management > Devices. The list of devices displays.
- Click the Devices tab.
- View the policy results:
- You can view the Policy Results column in the grid. If you do not see the column, click the columns dropdown menu, then select Policy Results to enable it.
- Review the policies in the Policy Results column.
Note:
You can see the total number of policies bound and the number of policies that were successfully applied.
- View the device policy results highlights.
- On the Devices tab, select the device for which you want to check the policy status.
- On the Device window, click the Highlights tab.
- Review the device highlights.
Note:
- The Policy Results card displays a chart. Each color on the chart denotes the specific status of the applied policies:
- Green (Successful) - Policies that are applied successfully on the device.
- Red (Failed) - Policies that were to be applied on the device and failed for various reasons.
- Yellow (Pending) - Policies that are waiting to be applied on the device.
- Blue (Duplicate)- When a policy is applied multiple times, it is executed only the first time and the rest are logged as duplicates.
- Light Blue (Unsupported OS) - Policies designed for specific Operating Systems/versions are applied to other OS/versions.
- The Device Policy Success Score is the percentage of policies that were successfully applied to the device.
- You can hover over the chart to view details of the Pending and Failed policies.
Viewing Policy Results
You can use the device Policy Results tab to view the policy results details.
- Go to Device Management > Devices. The list of devices displays.
- Click the Devices tab.
- On the Devices window, click the Policy Results tab.
- Click the view button next to the failed policy to view more details.
- You can check following in the details page:
- Exit Status - Indicates the status of the policy. 0 indicates Success. Any other value indicates an Error. See Understand Failed Policies and Windows Policy Conflicts for details.
- Details - Provides more details about the error. See Understand Failed Policies for details.
- Remediation - Provides a hyperlink to a KB article that provides remediation guidance for common errors.
- Click the hyperlink in the Remediation section to investigate the error further.
- Once you’ve viewed the details, click Close.
Back to Top


