
The Vault Connector HealthCheck feature allows you to analyze the status of each Vault Connector machine in your infrastructure. This tool helps you monitor crucial aspects such as hardware usage, service availability, and potential downtime.
Accessing the HealthCheck Panel
To access the HealthCheck Panel, you must have a Vault Connector version 23 or higher.
- Log in to your Vault platform.
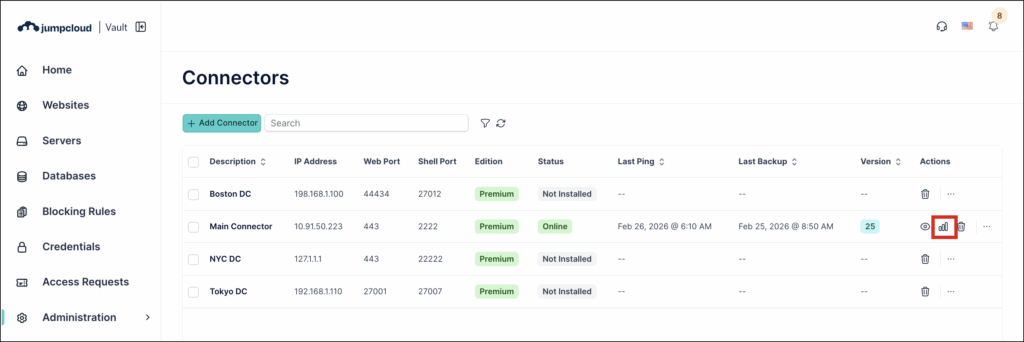
- Go to Administration > Connectors.
- Click the Health Check icon for an online connector.
Understanding the HealthCheck Data
Once inside the panel, you can view data for a single specified day. The panel provides detailed insights into:
- Latency: The time it takes for data to travel between points.
- CPU Usage: The percentage of CPU resources being used.
- Number of Simultaneous Connections: How many connections are active at the same time.
- Memory Usage: The amount of memory being consumed.
- Disk Usage: The amount of disk space being used.
- Vault Services Status: The current operational status of the Vault services.
![]()
All data is recorded in UTC, so manual time conversion may be necessary. By default, the last 7 days of data are available, and critical events are stored for an additional 6 months.
Alerts and Notifications
The HealthCheck system can trigger notifications for events that are outside of normal operation. These alerts can be sent via email or integrated with your SIEM. The first alert is sent 15 minutes after a Vault service or Connector failure.