Overview
Device Monitoring and Alerting allows you to use predefined rule templates to configure monitoring rules based on your needs. Alerts are generated in near real time once the monitoring rules are enabled. You can view and manage the generated alerts from the Alerts console in the JumpCloud Admin Portal.
Key Capabilities
- Directory and User Monitoring: Receive alerts for user additions and privilege changes in your JumpCloud directory.
- Agent Activity Monitoring: Monitor results of JumpCloud policy application, command execution, and software management.
- Custom Script-Based Monitoring: Create tailored monitoring using custom scripts to alert on specific conditions unique to your environment.
- Flexible Alert Configuration: Set up alerts with customizable thresholds and priorities to focus on what's most important to your organization.
- Centralized Alert Management: View and manage alerts directly from the JumpCloud admin portal.
Supported Platforms
Device support includes macOS, Windows, and Linux devices compatible with the JumpCloud Agent. Mobile Devices are currently not supported.
Limitations
- Software installations on Ubuntu devices via inbuilt application manager will not be identified for generating alerts.
Understanding Alerts
Once you set up and enable some monitoring rules, your devices are constantly monitored and alerts are generated in near real time when the specified rule conditions are met.
Jump to Additional Resources for a tutorial on Device Monitoring and Alerting.
The following types of alerts are currently available:
- Battery health monitoring alerts
- Command execution failure alerts
- Disk usage monitoring alerts
- Device uptime/offline monitoring alerts
- Policy application failure alerts
- Managed software installation failure alerts
- Software addition and removal alerts (when initiated by end users).
- User addition to JumpCloud directory
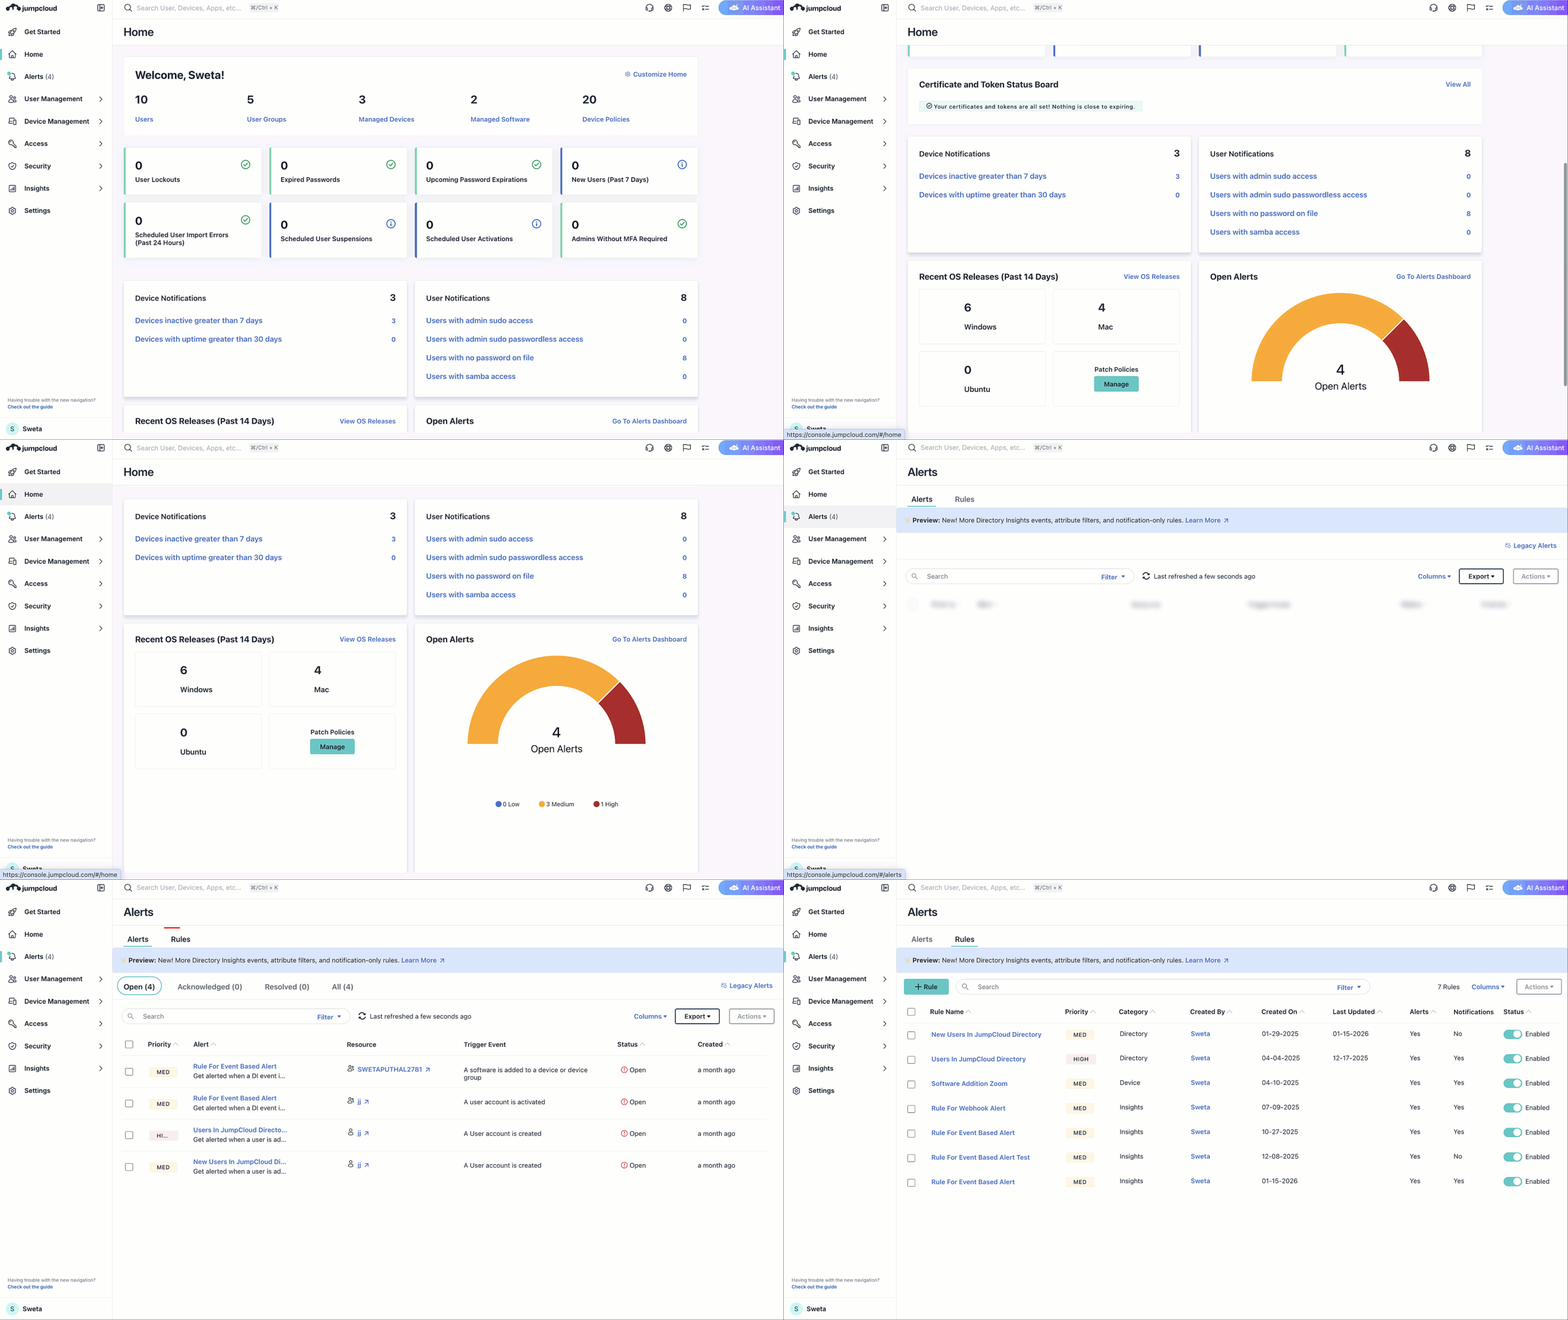
You can view and manage the generated alerts from the Alerts console of JumpCloud’s Admin Portal.
To access the Alerts console:
- Login to the JumpCloud Admin Portal.
If your data is stored outside of the US, check which login URL you should be using depending on your region. If your organization uses LDAP, RADIUS, or requires firewall allow list configuration, the Fully Qualified Domain Names (FQDNs) will also be region specific. See JumpCloud Data Centers for the URLs, FQDNs, and IP addresses.
- To view the Alerts console, you can do any of the following:
- In the left navigation, click Alerts.
- On the Home page, scroll down to the Open Alerts widget and click Go To Alerts Dashboard.

You will be redirected to the Alerts console which consists of two dashboards:
- Alerts: You can view, monitor, and manage all alerts here. See Use the Alerts Dashboard to learn more.
This dashboard consists of four tabs that display alerts based on their status:- Open: Displays all open alerts that need your attention.
- Acknowledged: Displays all alerts that have been marked acknowledged.
- Resolved: Displays all alerts that have been marked resolved.
- All: Displays all alerts.
- Rules: You can create new rules, monitor all the rules created within the organization, and manage the status of each rule here. See Use the Rules Dashboard to learn more.
You can:- Click Rule+ and create new rules.
- Use the toggle button to Enable or Disable a specific rule.
- Use the Actions button to select and enable/disable multiple rules at a time.
You will not see any alerts until you configure some monitoring rules. You can use the predefined rule templates to quickly configure some rules as per your requirements. Make sure to specify precise conditions while configuring the rules to receive timely alerts. See Configure Rules for Device Monitoring and Alerting to learn more.
A red dot on the Alerts (bell) icon indicates there are open alerts in the system.
- Previously, certain alerts were accessible through the bell icon in the top right corner of the interface. See Understand Legacy Alerts to learn more. With the new alerting system in place, these older alerts will no longer appear in the main alert dashboard. Instead, they have been moved to a dedicated page called Legacy Alerts.
- You can access this page by clicking Legacy Alerts in the top right corner of the Alerts dashboard. This page retains the original content of these alerts for your reference.
- While Legacy Alerts remain accessible, we do not plan to update or expand upon them in future as we focus on the new and improved alerting system.
Additional Resources
Tutorial: Device Monitoring and Alerting
Knowledge Base: Troubleshoot: Device Monitoring and Alerting Issues