Admin Portal Homepage
The Admin Portal Homepage is your starting point in JumpCloud. It shows organization health alerts, quick admin tasks, and data summaries for users and devices in one place.
Use Organization Health to see what needs attention, Quick Actions for common tasks, and Data Widgets for summaries of users, devices, passwords, MFA, OS versions, and AI & SaaS apps. Switch to My Activity Log tab to review your recent actions in Directory Insights. You can reorder sections and add widgets so Home shows what you use most — changes apply to your view only.
To view the homepage:
- Log in to the JumpCloud Admin Portal.
If your data is stored outside of the US, check which login URL you should be using depending on your region. If your organization uses LDAP, RADIUS, or requires firewall allow list configuration, the Fully Qualified Domain Names (FQDNs) will also be region specific. See JumpCloud Data Centers for the URLs, FQDNs, and IP addresses.
- In the left navigation pane, click Home.
The home page is displayed. The first thing you see is a personalized welcome message under the Global Search bar.
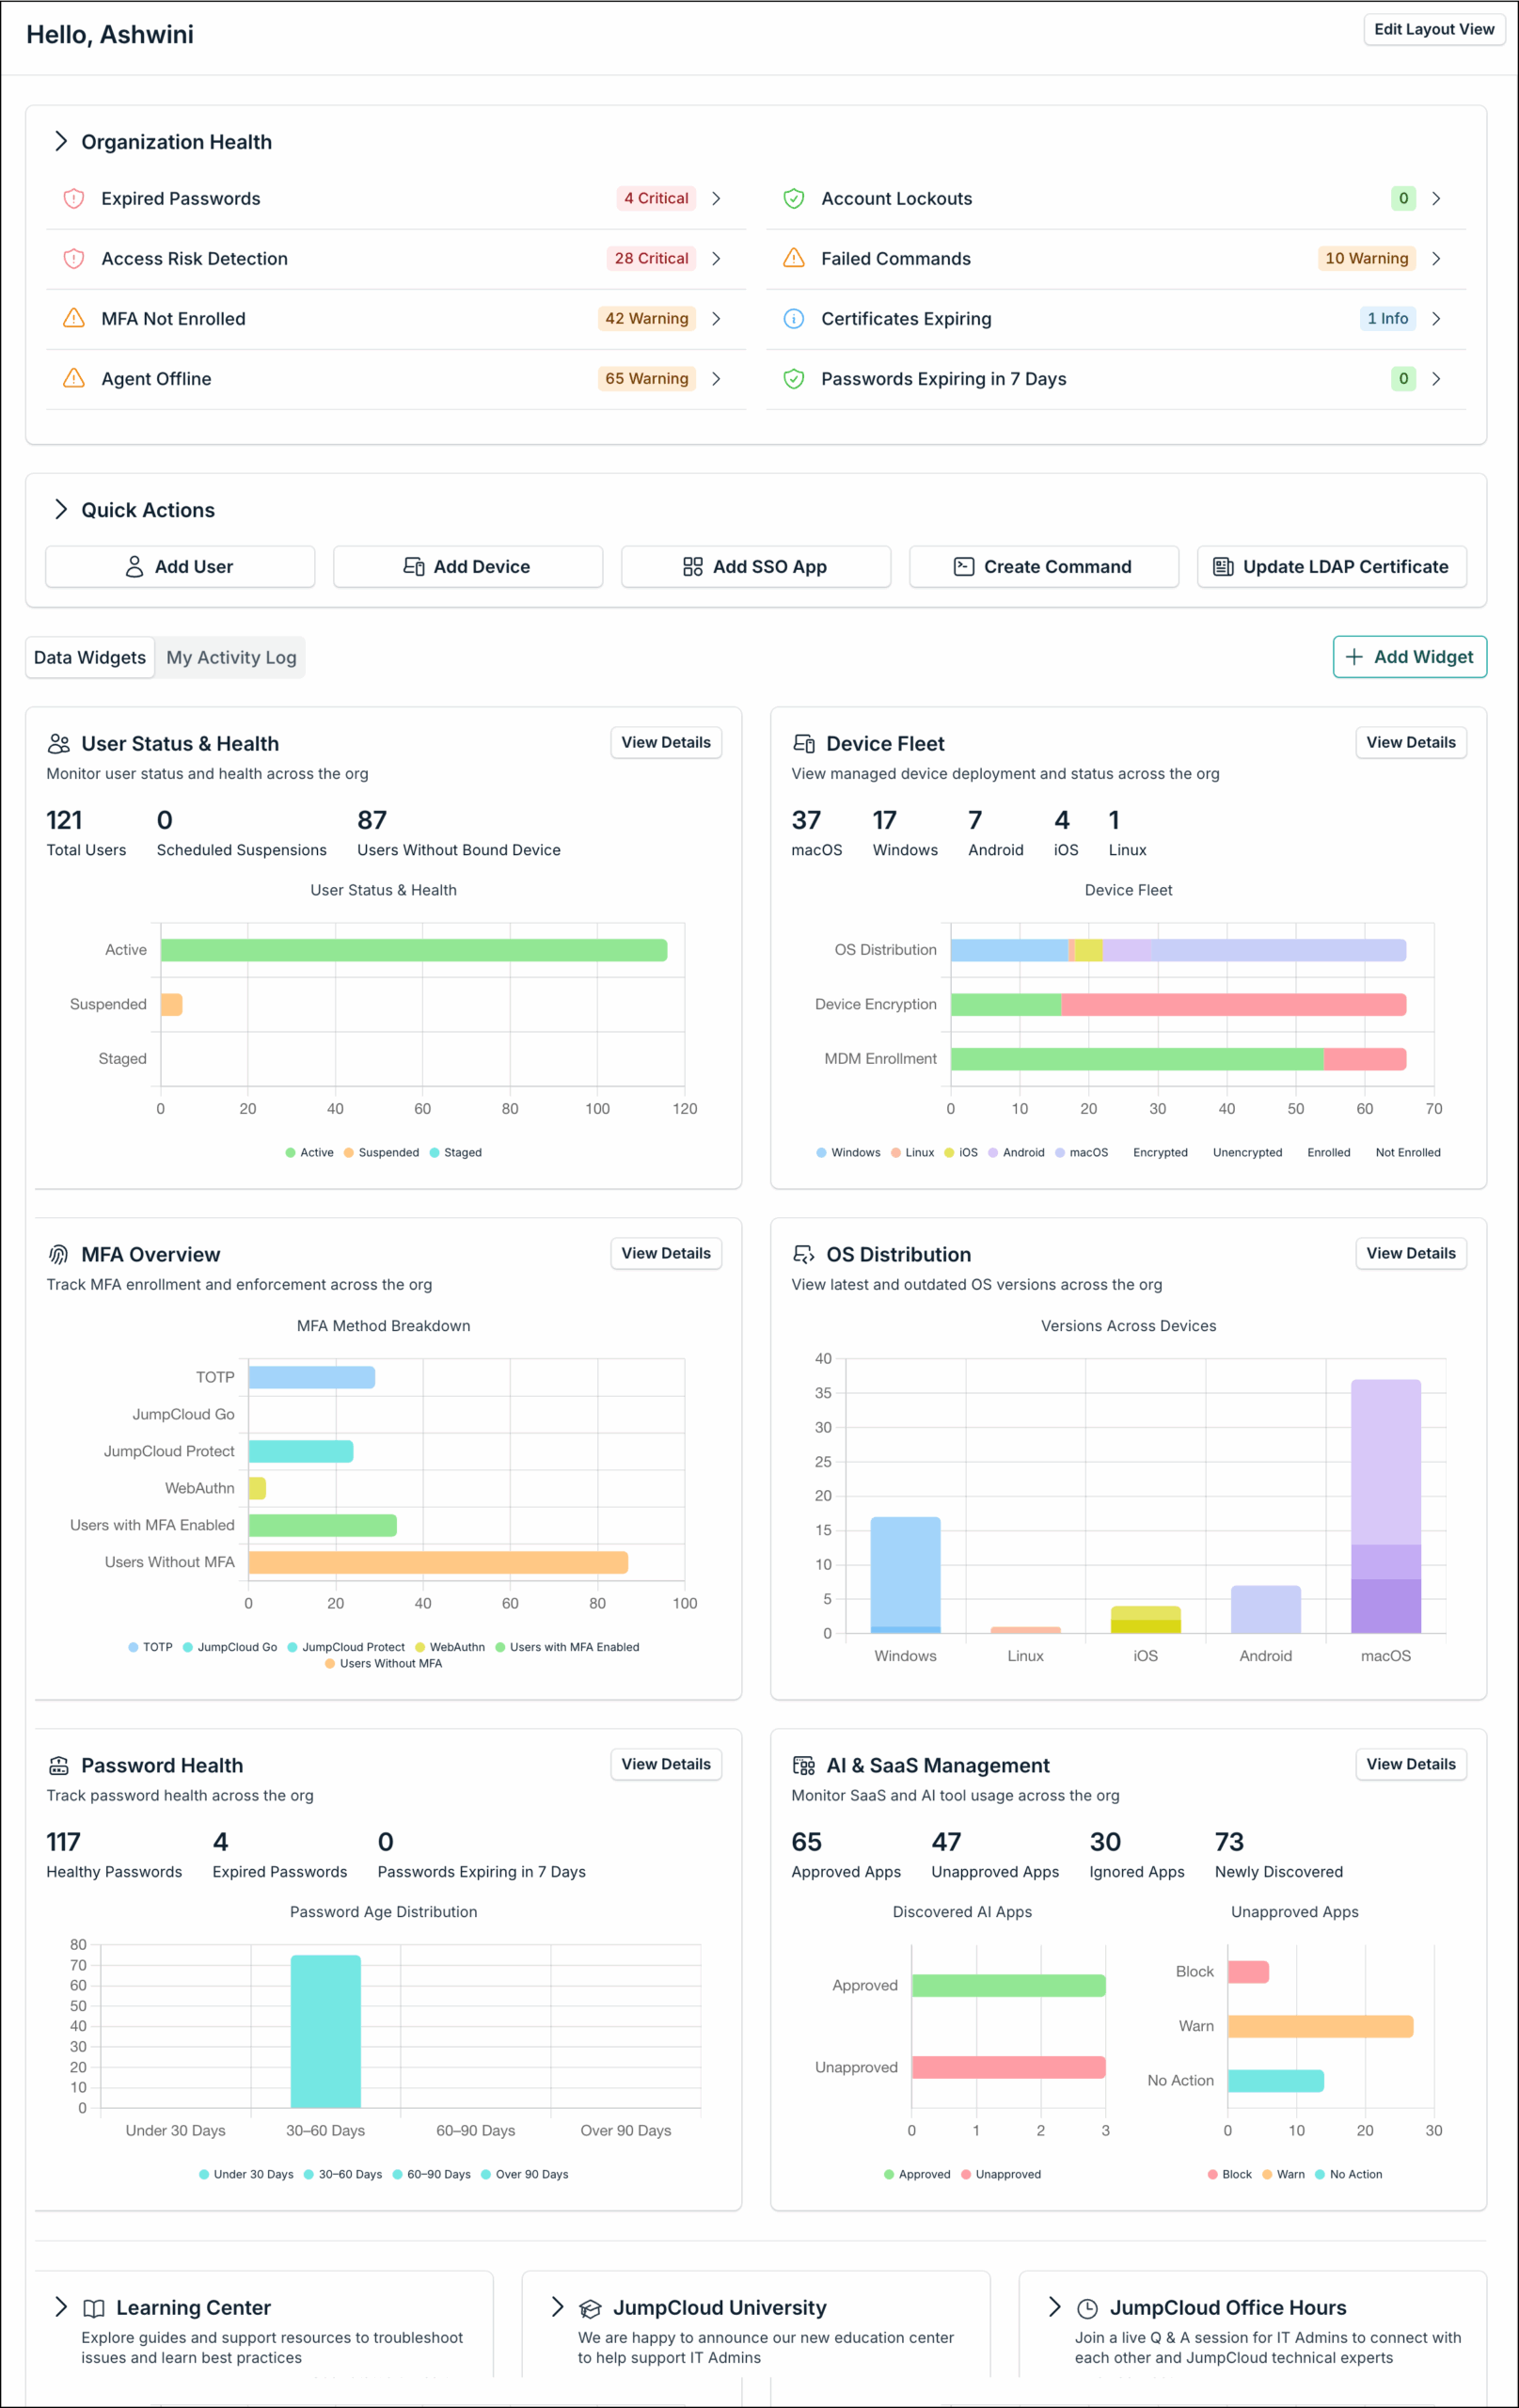
The home page contains various widgets that display the overview status of your orgs, users, devices, and more. Each widget contains a View Details button in the top right corner. Clicking this will automatically open the related area in the Admin Portal (for example Users, Devices, or Security) where you can view more detail.
Organization Health
The Organization Health card highlights immediate security and org vulnerabilities that require admin attention.
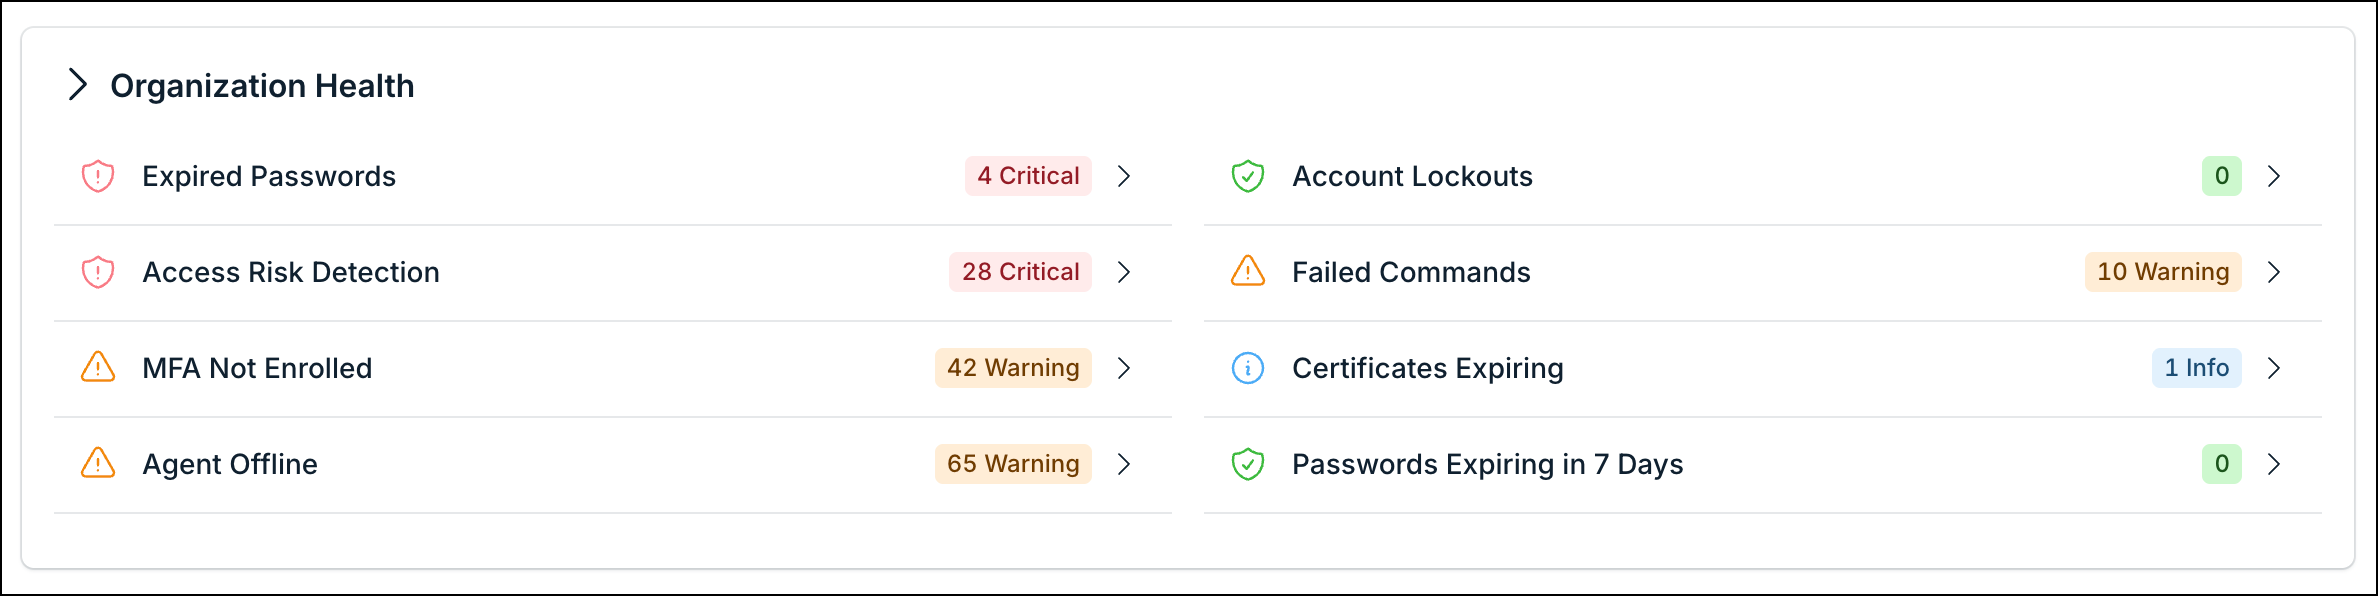
It categorizes alerts into:
- Critical: Highlights high-risk areas, such as Access Risk Detection.
- Warnings: Alerts you to non-critical but urgent security gaps, such as MFA not Enabled or Agent Offline.
- Healthy statuses: Items with a green checkmark show no issues right now — for example
Failed Commands: 0orPasswords Expiring in 7 Days: 0. Critical and warning items (such as expired passwords, MFA not enrolled, or agents offline) use red or orange tags when action is needed.
Clicking the arrow( **>**)next to any item will open the related settings or logs to resolve the issue.
Quick Actions
The Quick Actions card contains actionable shortcuts designed to speed up administrative workflows.
You can perform the following tasks directly from the dashboard:
- Add User: Instantly opens the user provisioning form.
- Add Device: Opens the Devices section to add a device.
- Add SSO App: Quickly configure a new Single Sign-On application integration.
- Create Command: Opens the JumpCloud Command interface to run a command.
- Update LDAP Certificate: Quickly manage secure LDAP authentication settings.
Data Widgets Dashboard
The main section features individual reporting widgets.
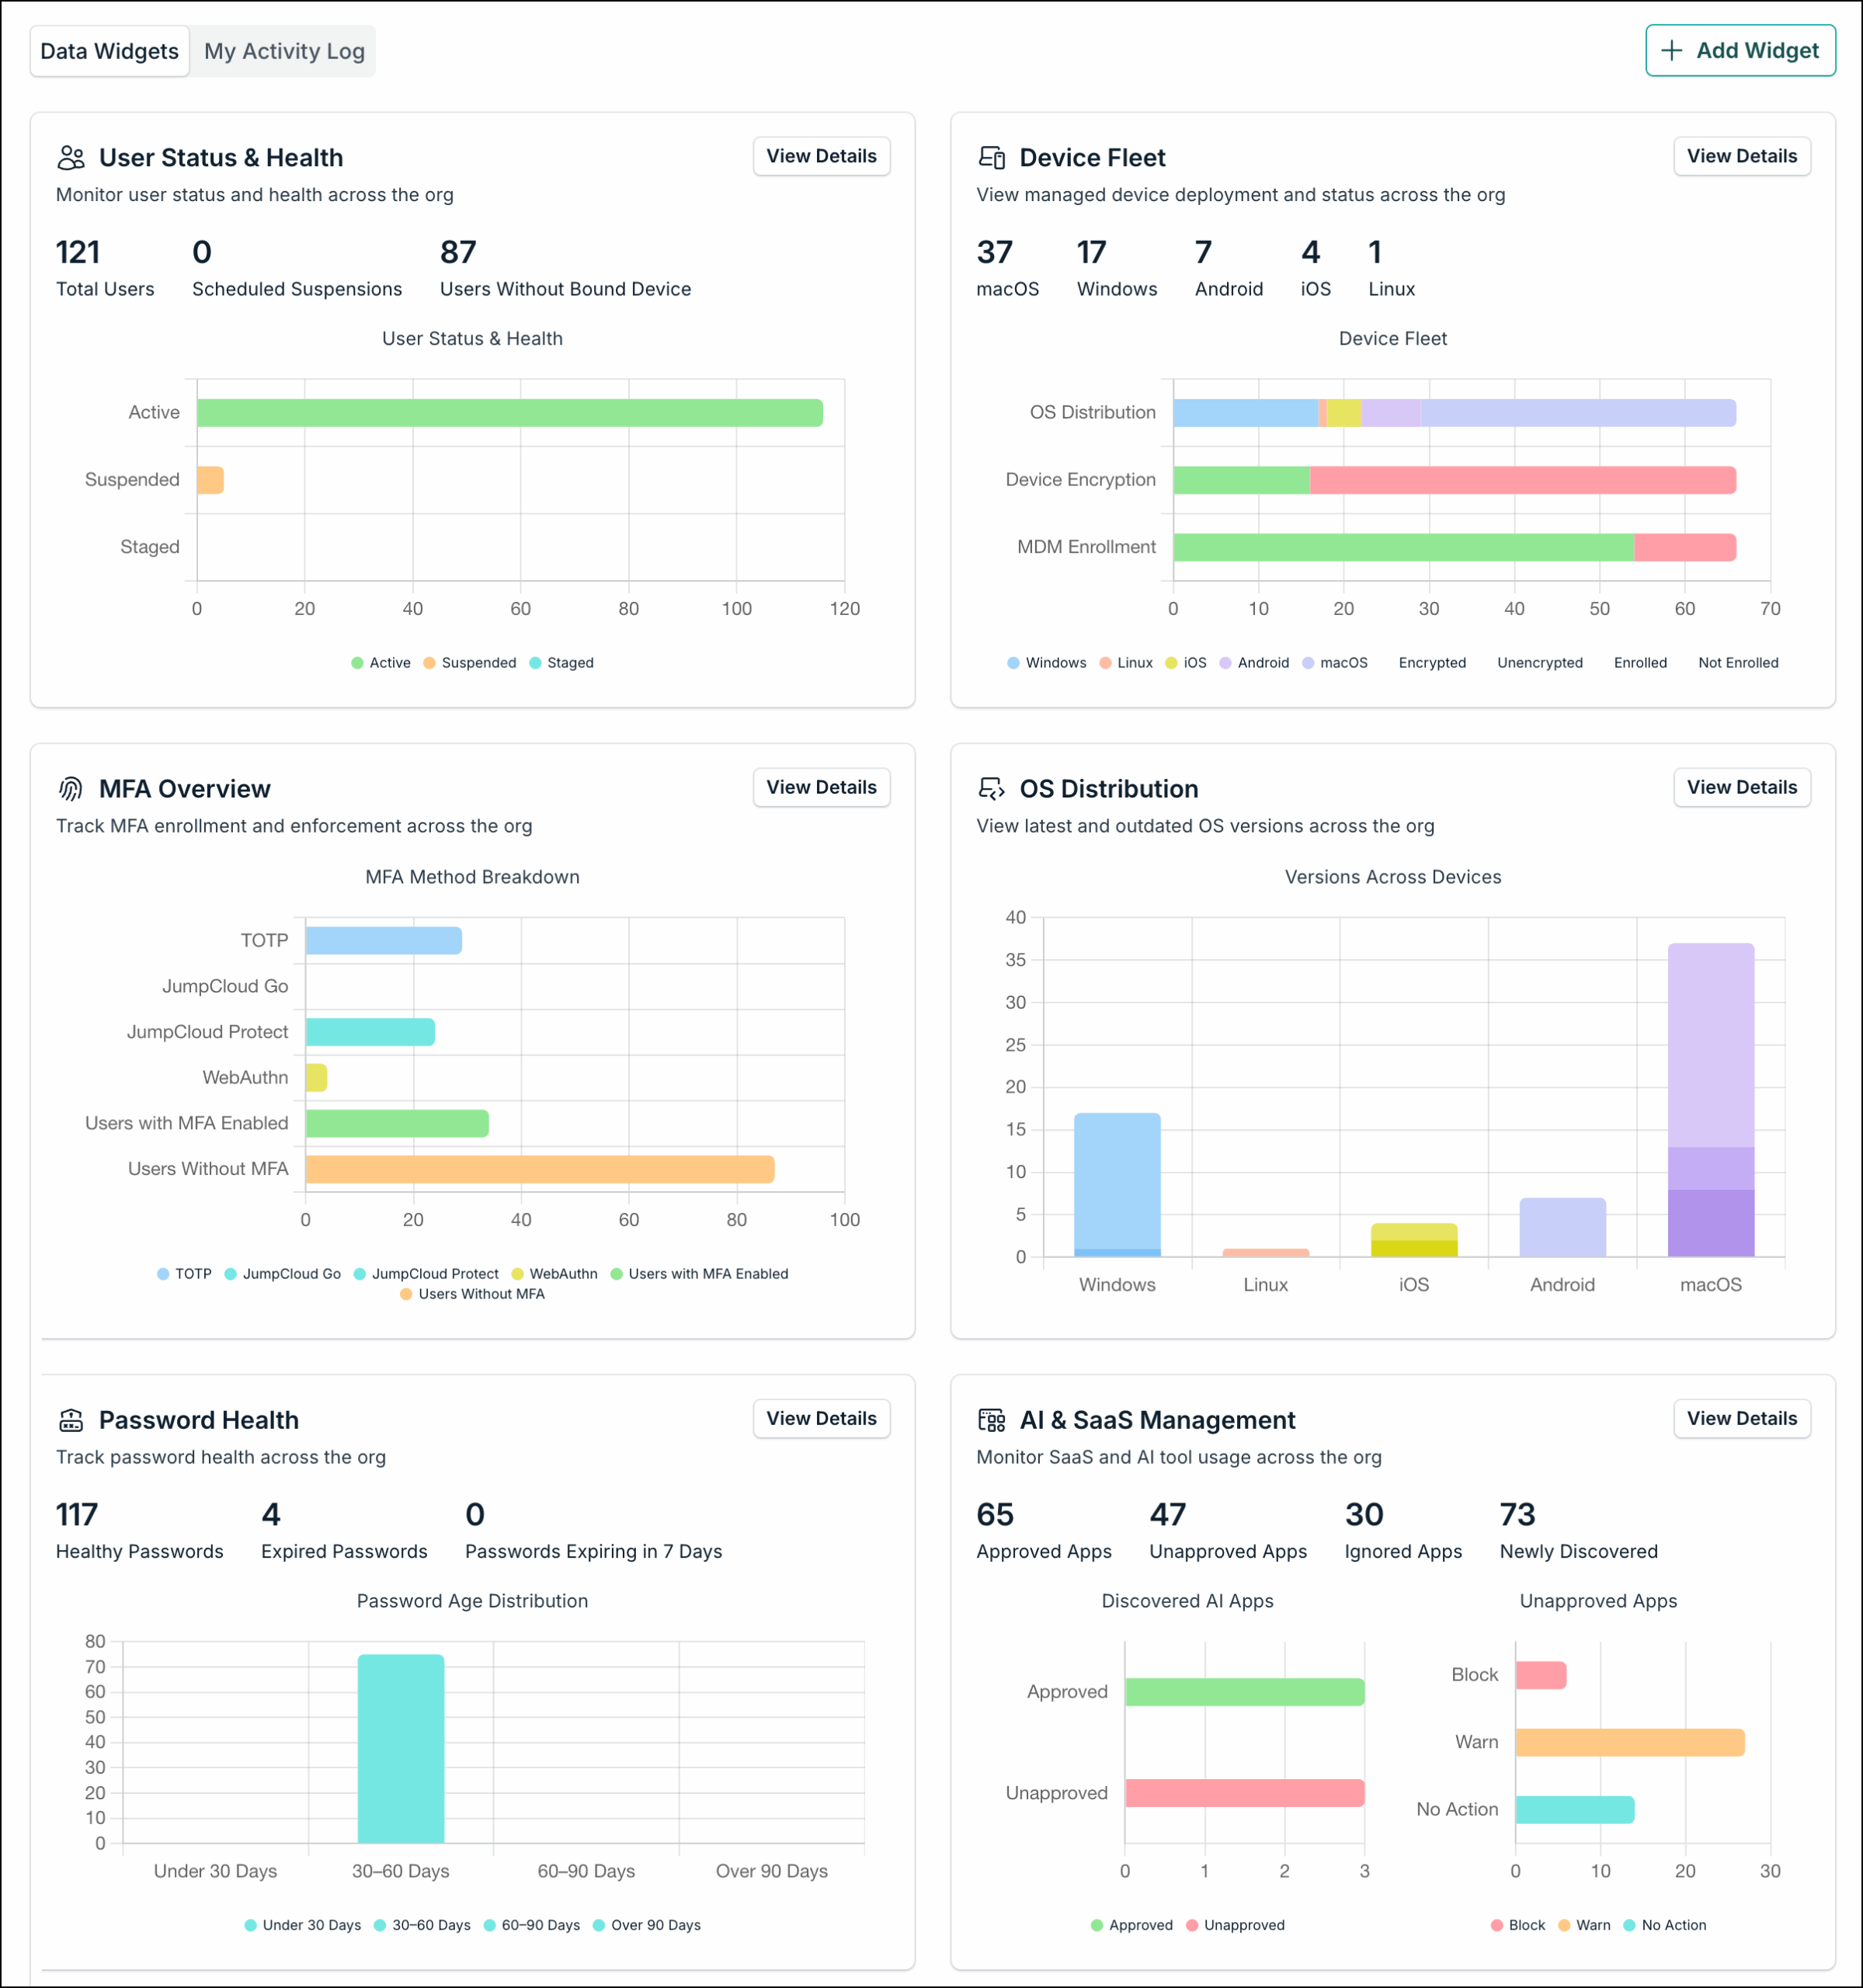
User Status & Health
Summarizes user accounts and device binding.
- Total Users Breakdown: Displays total active, suspended, or staged accounts.
- Users Without Bound Device: Tracks how many users in your system do not currently have a primary device assigned to them (useful for compliance auditing).
Device Fleet
Shows device counts by OS, encryption, and MDM enrollment.
- Device counts by OS (Windows, macOS, Android, Linux, iOS).
- Device Encryption: Visualizes how many devices have active BitLocker/FileVault encryption versus those that are unencrypted.
- MDM Enrollment: Displays a color-coded chart showcasing the percentage of endpoints successfully enrolled in JumpCloud MDM.
Password Health
Tracks password health and password age across your org.
- Offers a visual metric of Healthy Passwords, Expired Passwords, and upcoming expirations.
- Includes a Password Age Distribution graph to analyze how old user credentials are across your organization.
Multi-factor Authentication
Track MFA enrollment and methods across your org.
- Users with MFA enabled vs users without MFA
- MFA method breakdown (TOTP, JumpCloud Go, JumpCloud Protect, WebAuthn, Security Key)
OS Distribution
Shows latest and outdated OS versions across devices.
- Device counts by OS (Windows, macOS, Android, Linux, iOS).
- Latest vs outdated version breakdown
AI & SaaS Management
Monitor approved, unapproved, and discovered SaaS and AI apps.
- At-a-Glance Counters: Quickly see a tally of Approved Apps, Unapproved Apps, Ignored Apps, Newly Discovered.
- Charts for Unapproved apps and Discovered AI Apps
Creating Custom Data Widgets
If the default layout doesn't cover everything you need, you can build your own tailored widget using the Custom Widget Builder. This allows you to focus on the metrics you care about and pin the exact metrics you care about most right to your Homepage.
To create a custom widget:
-
Click the + Add Widget button.
-
From the Category dropdown, choose the main area you want to track (such as specific user metrics, device groups, or security states).
-
Use the conditional logic fields to narrow down exactly what the widget displays:
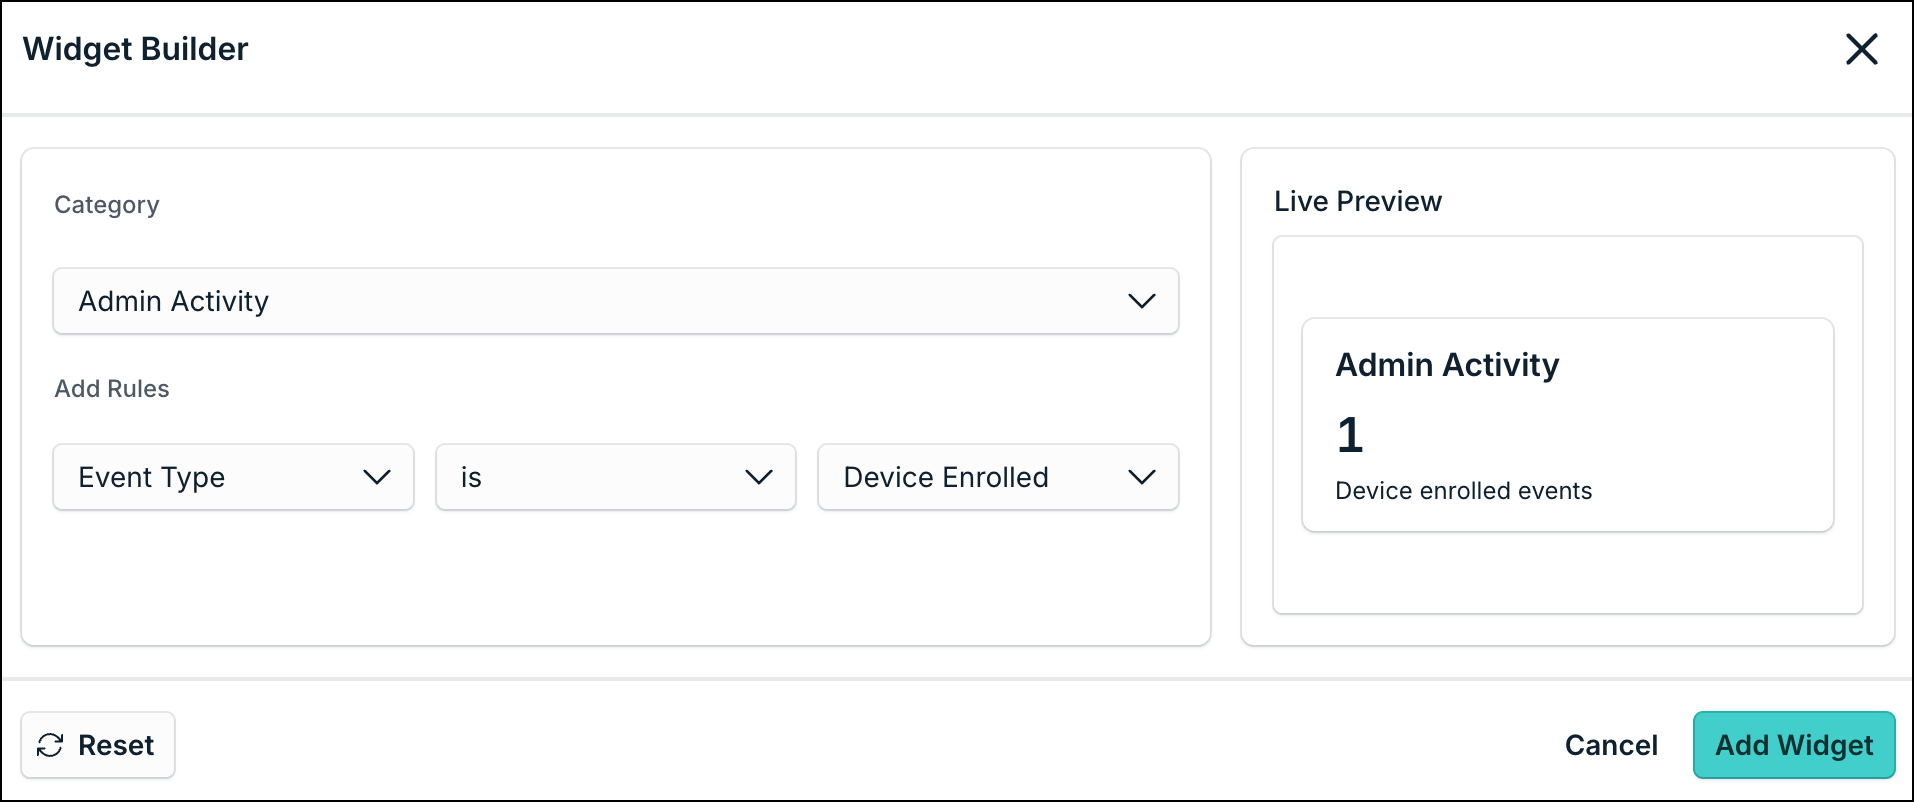
- Attributes: Choose the specific property you want to evaluate.
- Operator: Decide how you want to measure it (e.g., equals, contains, does not equal).
- Value: Define the target criteria or threshold you are looking for.
-
As you build and tweak your rules, the Live Preview pane on the right will update in real-time. This shows you exactly how your data will look on the Homepage before you publish it.
-
If you like what you see, click Add Widget to your homepage. If you want to try a different angle, simply hit Reset to clear the fields and start fresh.
Customizing Your Homepage Layout
You can edit the layout and customize the information you see on your homepage. Keep in mind that layout changes apply to your Home view only and do not affect other admins. While Organization Health and data widgets reflect org-wide data, the section order and which widgets you see are personal.
To customize your Homepage:
-
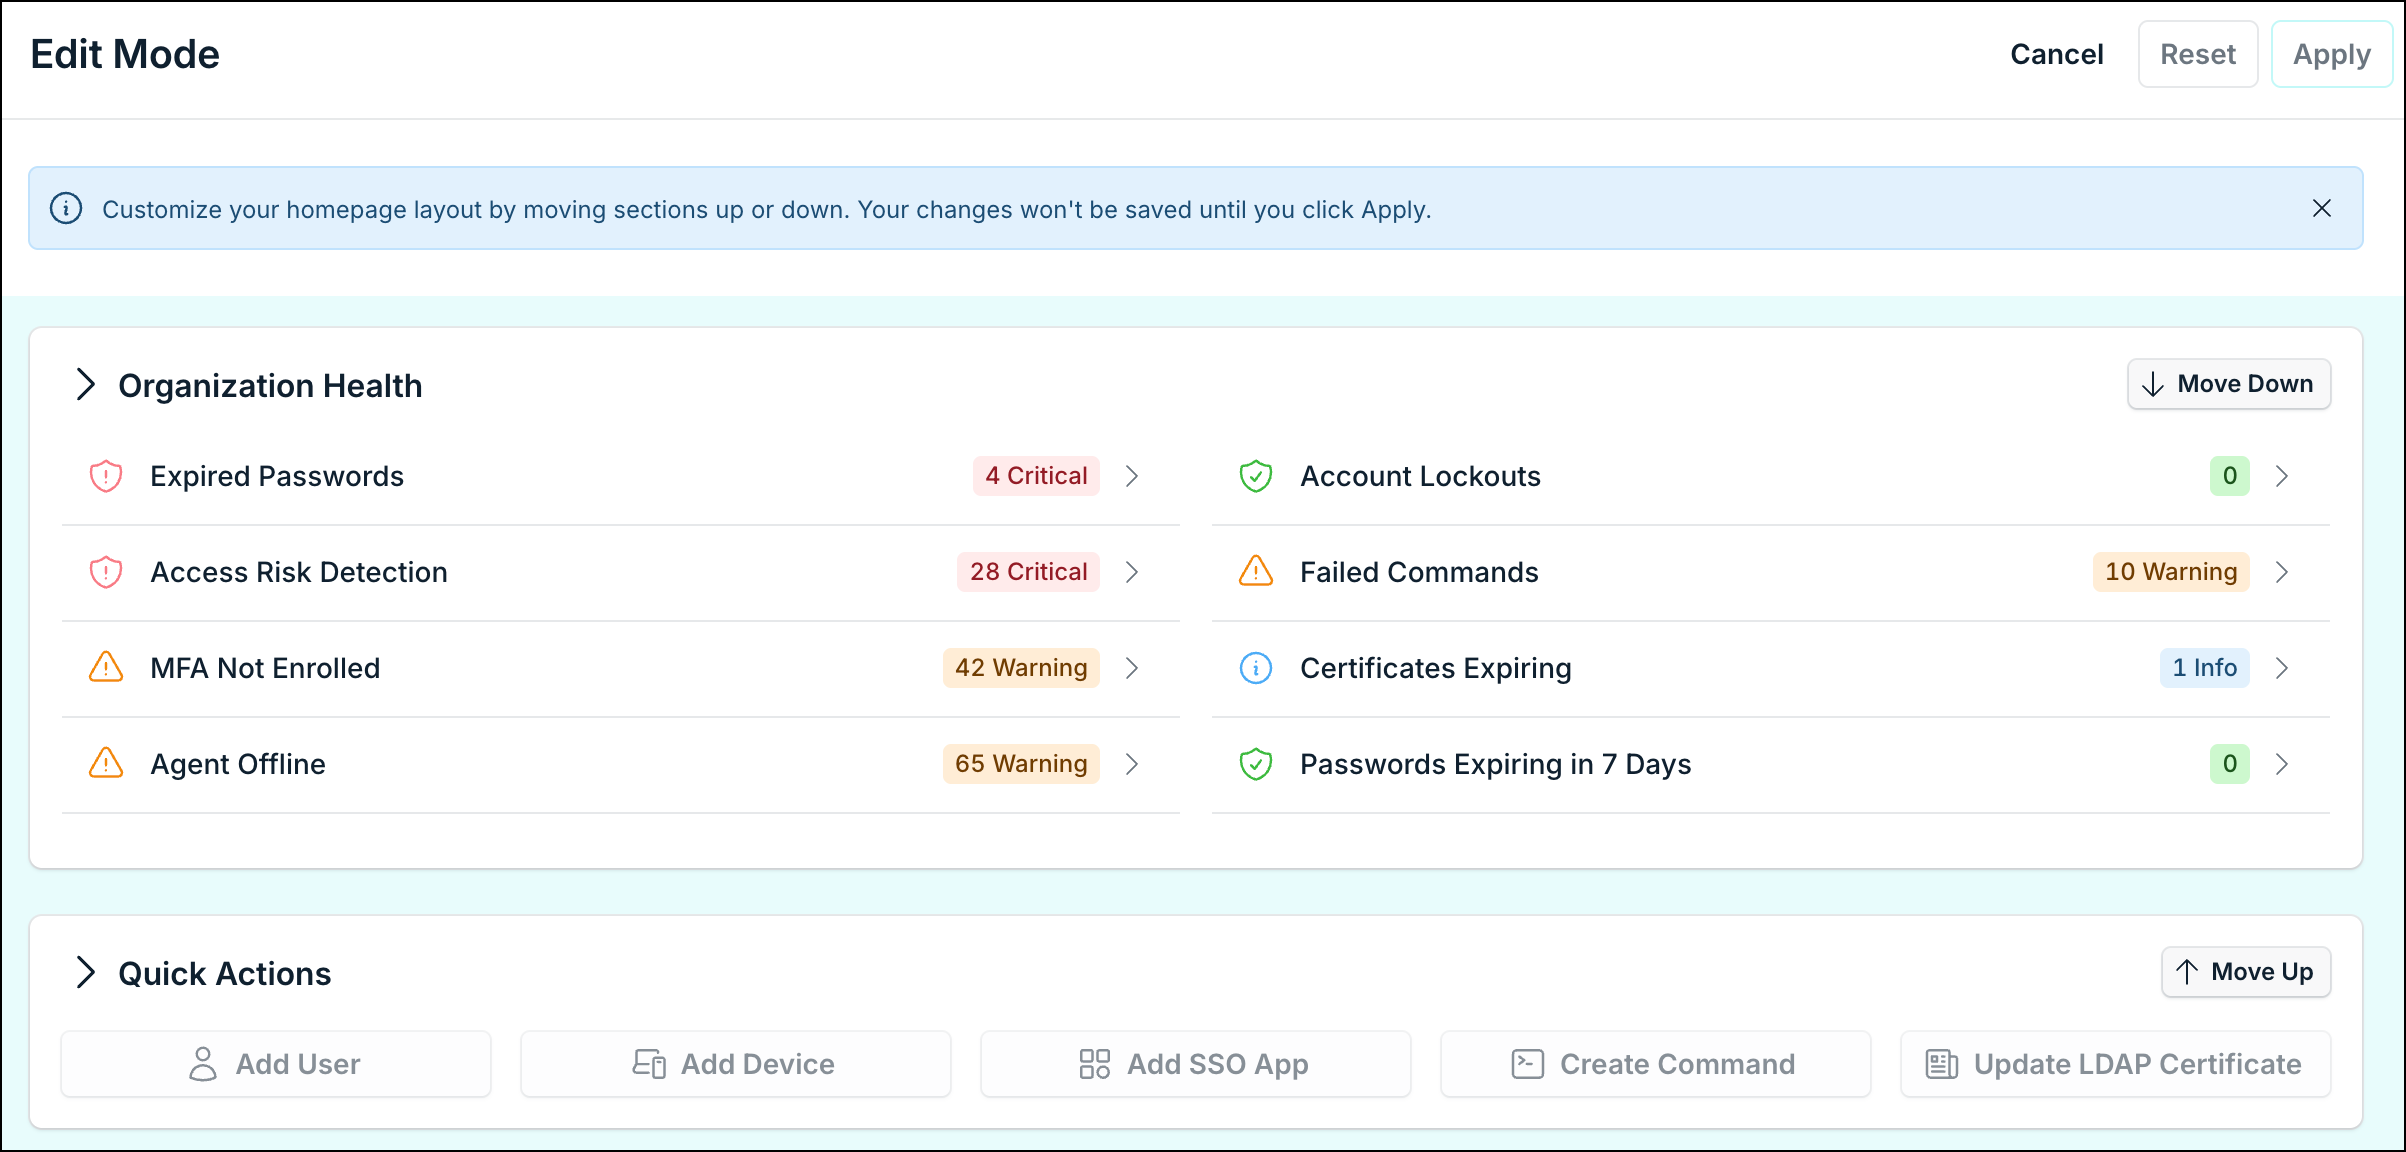
In the JumpCloud Admin Portal, click Edit Layout View in the top right to switch to the Edit mode.
-
Use the Move Up and Move Down buttons to switch the widget positions. For example, if you do not wish to see Organization Health first, you can move it to the bottom of the page. If you want to see a specific data widget at the top, you can move it up.
-
(Optional) You can also delete the Custom Widgets that you built in the Edit mode.
-
Once you are done changing the layout, click Apply. Your changes will be applied and you will only see what you want to see in the Home page.
Alternatively, to exit without saving, click Cancel and confirm Discard Changes in the dialog. -
If you wish to undo your changes, click Reset.
Was this information helpful?