Connect


Updated on November 13, 2023
Calculating total cost of ownership (TCO) helps you analyze the costs of your IT environment, including past, current, and projected future costs. JumpCloud’s free TCO calculator has built-in analysis tools that help you compare projected costs of different solution options and build reports and graphs of your findings. This blog will cover how to use the tool. There’s also a more in-depth guide and video to walk you through the process.
- Download the TCO calculator (the link will make a copy of the template so you can plug in your own numbers).
- Watch the demo on how to use the TCO calculator.
Download the TCO Guide to explore the concepts and calculations surrounding TCO.
What is the TCO Calculator?
Before we dive into the “how,” let’s briefly go over the “what.”
The purpose of the TCO calculator is to help you understand, compare, and communicate the total cost (which includes both the direct and indirect costs) of up to three items. For example, you could use it to compare a new tool with an existing one, compare multiple new technologies you are evaluating, or review and assess various approaches to managing your IT environment. You can even use this tool to calculate the TCO of hosting your infrastructure in the cloud instead versus on-premises, or to see if it’s worth unifying your stack by removing some point solutions in favor of another holistic solution.
This calculator not only helps you understand your TCO, but it also helps you communicate cost factors to others with built-in graphs, analyses, and more. Sharing these with decision-makers, the finance department, and other stakeholders can help inform and support IT purchasing decisions.
How to Use the TCO Calculator
Open the TCO calculator in Google Sheets and click “make a copy.” (It prompts you to make a copy so you can plug in your own numbers and edit the sheet).
![]()
Note: We do not currently have a supported calculator for Microsoft Excel, macOS Numbers or other available spreadsheet tools. Check back for additional supported platforms.
When you open the calculator, start off on the “Template Instructions” tab.
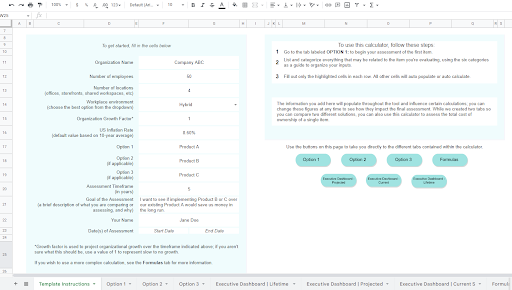
Template Instructions Tab
This tab shows you high-level instructions on how you can use the calculator.
The more information that you fill out down the left hand side of this tab, the more robust your results will be. This information is used throughout the calculator, in some cases for calculations themselves, and for personal reference and context in others.
Organization Growth Factor: The default is 1 representing little to no growth — feel free to change this if needed.
U.S. Inflation Rate: The default value of 2.65% is based on a 10-year average; feel free to tweak this based on how you want to make future projections.
Options 1, 2, and 3: The calculator supports comparisons of up to three options.
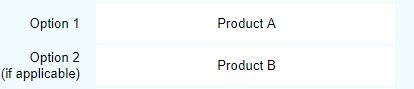
However, you don’t have to use multiple options if they’re not relevant to you. If you want to do an analysis of your current TCO for something you own, add a name for it next to “Option 1.” If you want to do multi-product comparisons — whether this is comparing new products to a product you already own or all new products — add names for them next to each relevant option. The text you add here will automatically populate at the top of each corresponding option tab.
Name Options and Add Assessment Timeframes
However, you don’t have to use multiple options if they’re not relevant to you. If you want to do an analysis of your current TCO for something you own, add a name for it next to “Option 1”. If you want to do multi-product comparisons — whether this is comparing new products to a product you already own or all new products, add names for them next to each relevant option. The text you add here will automatically populate at the top of each corresponding option tab.
Assessment Timeframe: If you’re using the calculator to run future projections, you’ll need to add an assessment timeframe in years. We recommend using 3-5 years.
To use the buttons on the right hand side of this tab, in Google Sheets, you will be prompted to give permission for a script to be run.
Options Tabs
Start with the “Option 1” tab, and fill out the “Option 2” and “Option 3” tabs only if you’re doing a comparison. Each option tab has the same information on it.
There are six major categories on each tab:
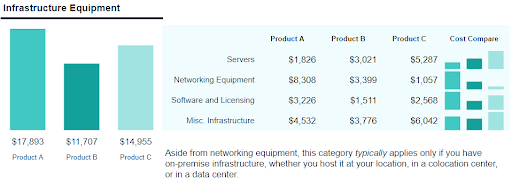
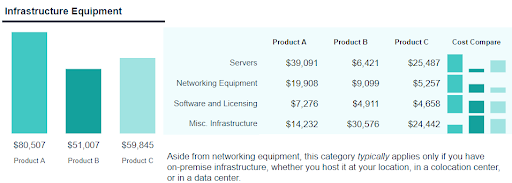
- Infrastructure equipment: Aside from networking equipment, this category typically applies only if you have on-premise infrastructure, whether you host it at your location, in a colocation center, or in a data center.
- Data center/housing costs: Data center and hosting costs also mainly apply to companies with on-premise infrastructure. This category includes all the costs of housing, powering, and physically securing infrastructure equipment.
- Software and applications: This category tends to be extensive, and it varies significantly from company to company. It is meant to address the variety of software solutions that IT uses for their work, as well as any software solutions IT manages and/or pays for.
- Devices and hardware: Any physical hardware and associated connectivity plans purchased by your company and issued to employees falls under this category.
- Personnel and support: Typically, these are the labor costs associated with configuring, supporting, and managing the item under assessment rather than the costs associated with more generalized day-to-day activities and job function.
- Rollout: Introducing a new tool or stack requires time and money for implementation and configuration, as well as training for those who will use it on an ongoing basis.
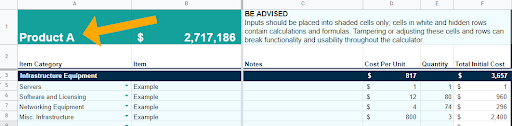
Instructions for the Options Tabs:
BE ADVISED: Inputs should be placed into shaded cells only; cells in white and hidden rows contain calculations and formulas. Tampering or adjusting these cells and rows can break functionality and usability throughout the calculator.
- For whatever you’re assessing as an option, add each aspect to the appropriate category in the top-most row under “Item”.
- Then, choose the subcategory for that item from the dropdown to the best of your ability.
- From there, fill in only the blue/shaded cells for each item you add. The white cells will be calculated for you. Fill in the most blue cells that you can to get the most accurate outcome as possible.

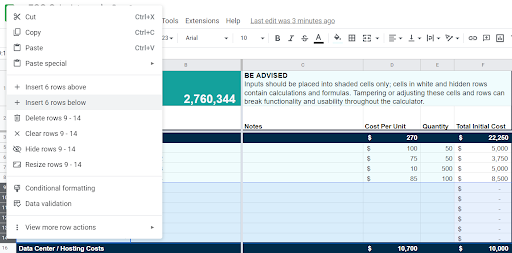
- If you have more items to add than there are rows, select the bottom row within the proper category, right click on it, and choose “Insert 1 row below” so as to not hurt the functionality of the sheet.
- Need to add more than one row? Select the bottom row in the category, highlight multiple rows going up, right click, and select “Insert x rows below”. There is no limit to the number of rows you can add.
Executive Dashboard | Current Solution TCO Tab
Use case for this tab: When you filled out the “Option 1” tab, and you want to further analyze the TCO of something you currently own.
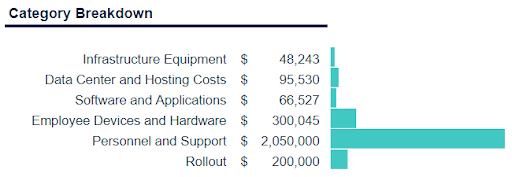
This tab shows you the total cost of that particular solution, as well as a breakdown of the costs by category.
Executive Dashboard | Projected TCO Tab
Use case for this tab: When you want to compare future costs of two or three different options.
This tab will take all of the projected costs starting from the day you fill out the calculator, through the timeframe that you set in the “Template Instructions” tab. It compares all of those costs side by side, broken down by category and subcategory.
Use this tab to visualize and compare the data you added into the relevant option tabs, in order to make more informed decisions around the solutions you currently employ or are looking to purchase.
Tip: Copy and paste or screenshot sections from this tab into a slideshow to present to other stakeholders and decision makers in a simple to read and visually pleasing way.
Executive Dashboard | Lifetime TCO Tab
Use case for this tab: When you want to compare the lifetime costs of two or three different options.
The difference between this tab and the “Projected TCO” tab is that this tab takes into account past costs as well as future costs. This is more of a holistic analysis, rather than just future projections.
Tip: Copy and paste or screenshot sections from this tab into a slideshow to present to other stakeholders and decision makers in a simple to read and visually pleasing way.
Formulas Tab
This tab includes four formulas that are relevant to calculating TCO. You can change the data in the blue cells, as well as the rate of inflation, to be more representative of your organization in particular, to get more accurate results from the calculator.
Compound Inflation Calculator: Feel free to adjust the rate of inflation and the present value.
Labor Costs per Worker: Feel free to adjust the salary and time spent on the task per month cells.
Convert Time to Years: Feel free to add data to all of the blue cells, so that the time can be converted into years, which is the unit used throughout the calculator.
Growth: Change the current number cell to the current number of employees that you have, and add in your expected growth rate to get a more accurate depiction of growth across the calculator.

Learn more about TCO, the concepts behind it, the math that goes into it, and more!