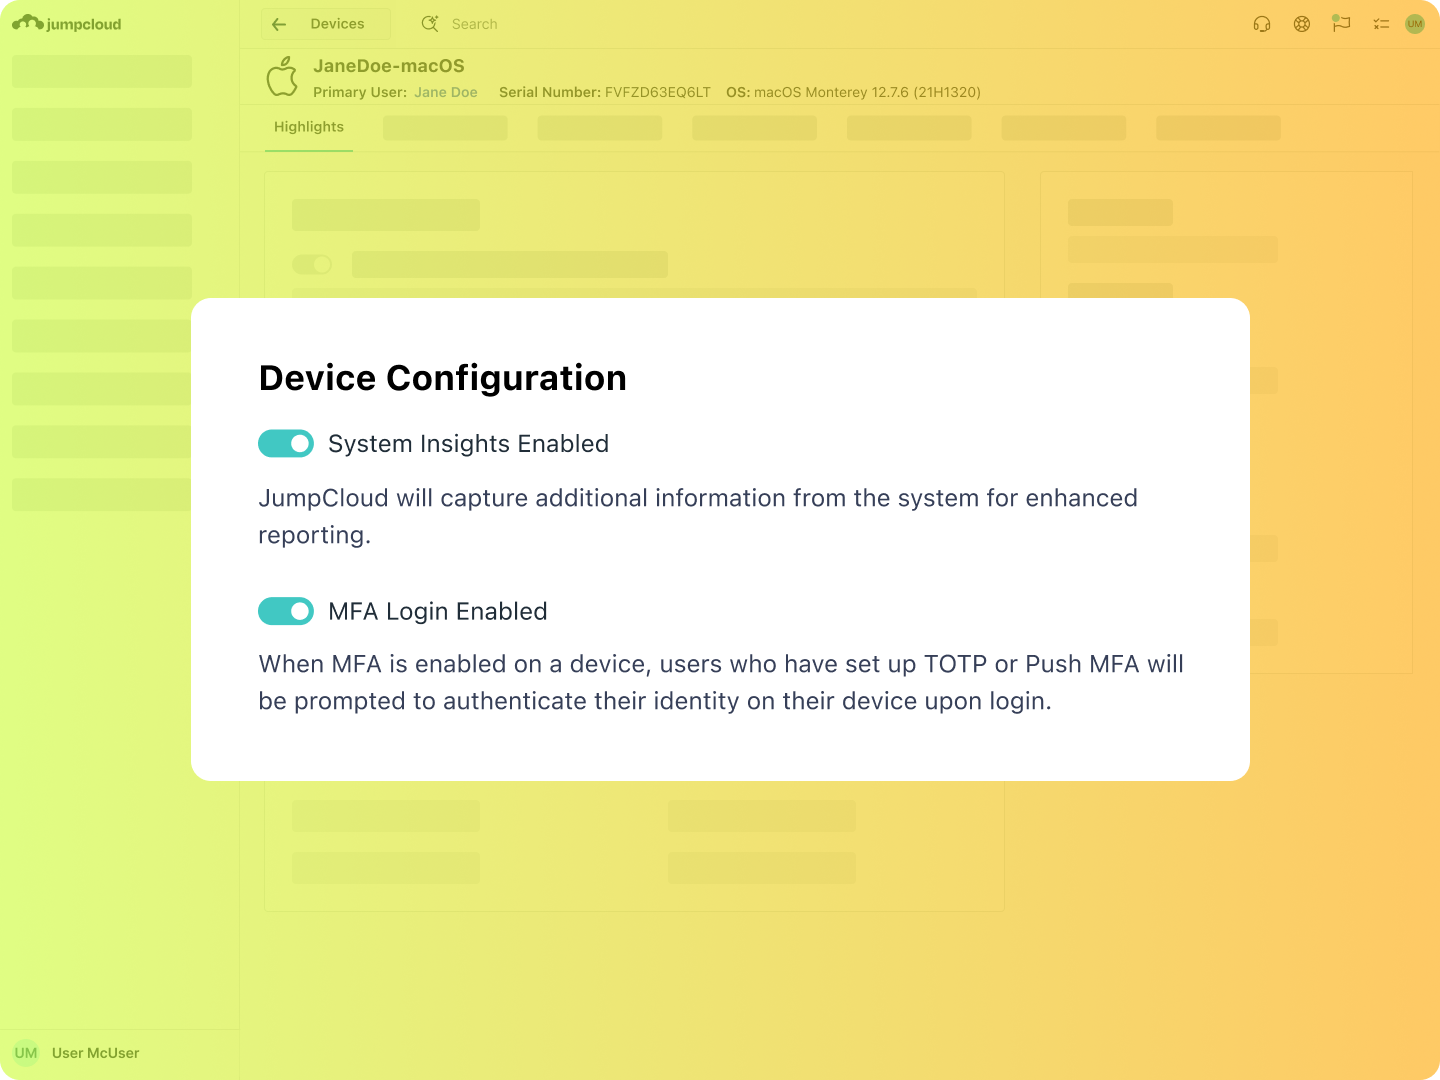
System Insights®
Device-level event visibility with access to accurate, real-time data across all managed devices.
Centralized, Intuitive System Data
Managing your fleet of devices is one thing; but gaining actionable visibility into each system is a challenge most IT departments struggle to overcome. Eliminate this issue with JumpCloud System Insights which monitors event data across all managed devices in real time to help you proactively identify and minimize risk, shut down threats, and streamline compliance efforts.
Easy Access to Data and Reports
View System Insights data and easily save custom views for future data access. Export data to csv or use native APIs to send your system data to a SIEM, asset management system, or analytics platform for advanced reporting and anomaly detection. Leverage prebuilt reports to achieve your compliance needs.
Video Tutorial
| Intro to System InsightsSupport Article
| JumpCloud System Insights
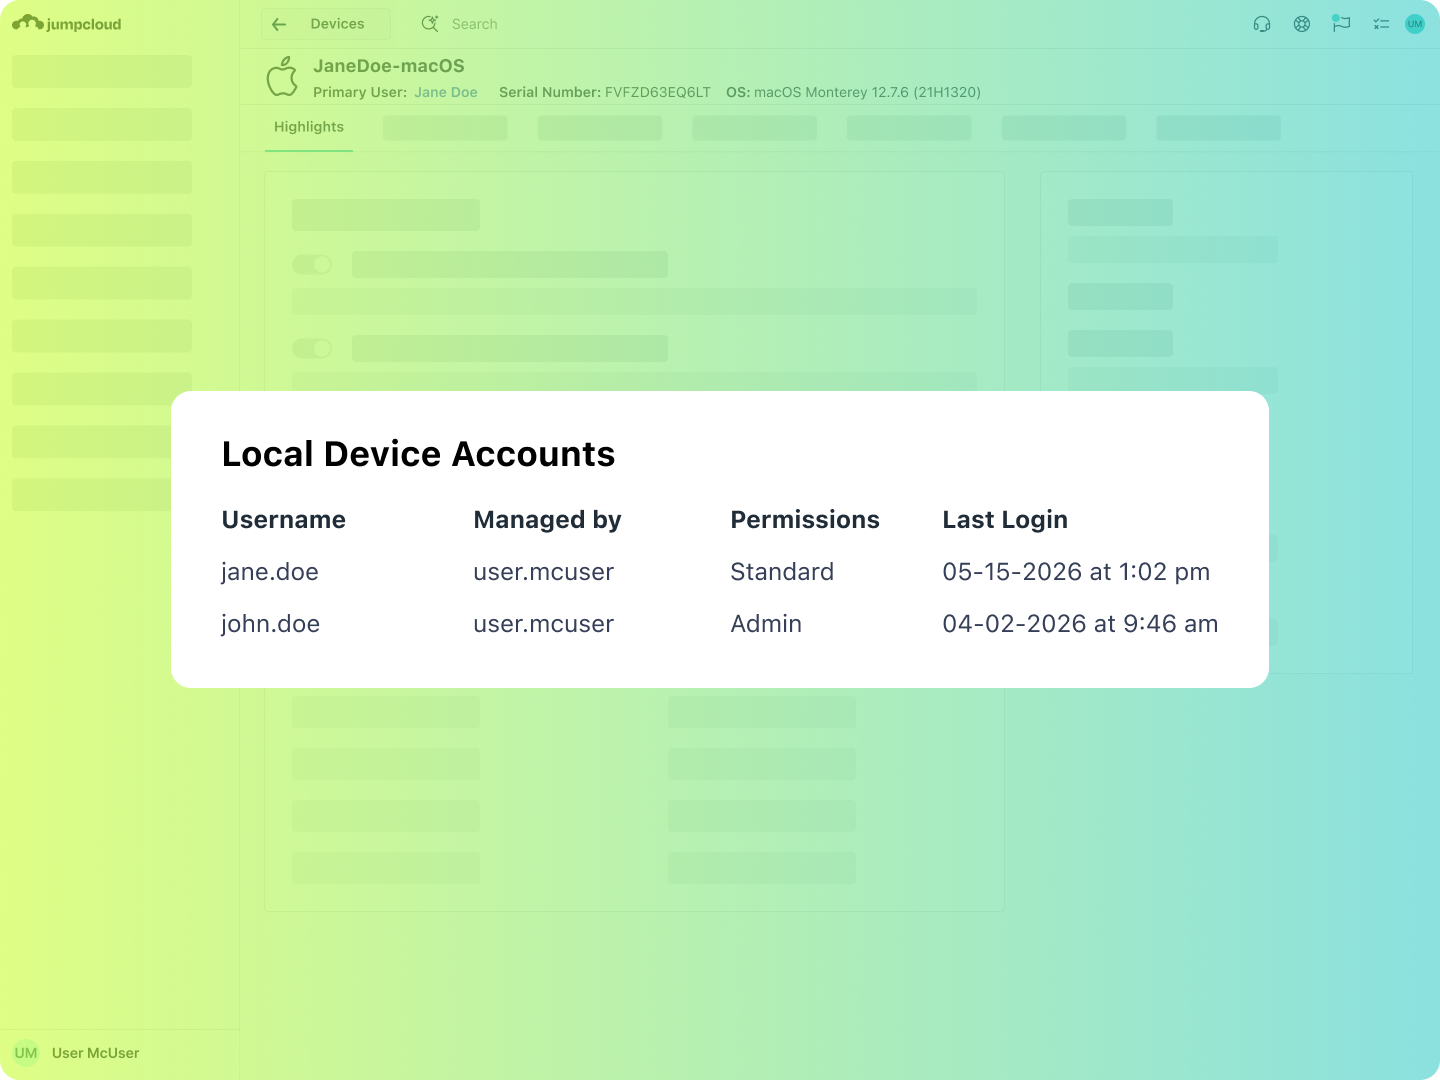
Secure and Compliant
Get a clear picture of who has access to a device via local user accounts, what software versions are running, and when critical patches have been installed. Interrogate devices and identify non-compliant systems for immediate remediation.
Blog Post
| Managing Device Health & TelemetrySupport Article
| How Do I Use and View System Insights Information?
Central Device Diagnostics
Identify aging devices across your organization by automatically collecting information on memory, storage capacity, uptime, and shared resources for IT budgeting and to eliminate unwanted downtime due to device malfunctions.
Support Article
| View OS System Update Events in DIBlog Post
| Cross-Platform System Insights: Mac, Windows, & Linux

Industry Awards & Recognition

Best Usability

Best Relationship

Leader

Best Results
Most Implementable
Explore JumpCloud Open Directory Platform Capabilities
Identity Management
Access Management
Device Management