Troubleshoot: How to Collect Jump Server Logs
Each container of the Jump Server writes its own log. These logs show what happened during a session, and they are the fastest way to find where a problem is: in the connection of the user, in the Jump Server, or in the target resource. Use this article to collect the logs, find the session that you need, and understand the most common messages.
This article is for administrators and support engineers who troubleshoot a Jump Server.
Docker writes the time in UTC. Know the approximate time of the problem and the time zone of the person who reported it before you filter logs.
Which container should I check?
Symptoms: A session or Jump Server problem occurred, and you need to know which container log to open first.
Resolution: Start with the container that handles the type of access that failed.
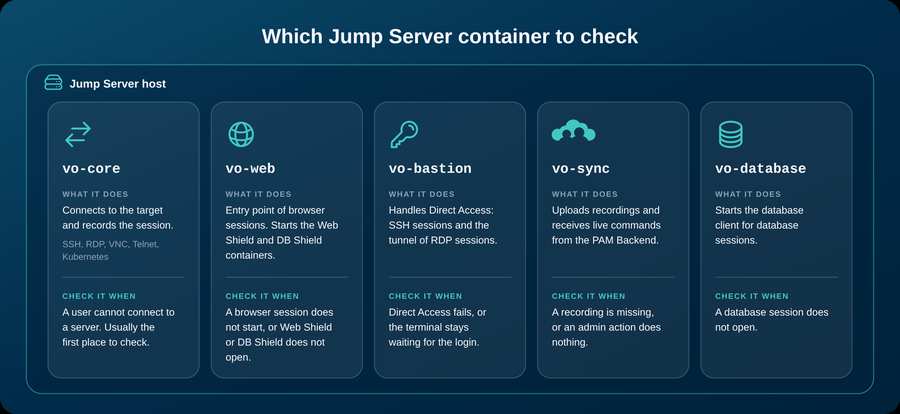
Before you begin:
-
You have root access to the Linux host where the Jump Server is installed.
-
You know the approximate time of the problem, and the time zone of the person who reported it.
-
If possible, you know the user, the resource, and the type of access (browser or Direct Access).
How do I collect logs from a Jump Server container?
Symptoms: You need the recent log lines from a Jump Server container to investigate a session or health issue.
Resolution: Open a terminal on the Jump Server host, switch to root, and run docker logs with the container name. These are the most useful options:
- Open a terminal on the host of the Jump Server and switch to the root user:
sudo su
- Show the last 200 lines with timestamps (UTC). Always use -t. Without it, the logs of vo-core do not show the time:
docker logs -t -n 200 vo-core
- Show only the last 30 minutes. You can also use a date, for example --since 2026-10-31T15:00:00Z:
docker logs -t --since 30m vo-core
- Follow the log in real time. Ask the user to reproduce the problem, and then press Ctrl+C to stop:
docker logs -t -f vo-core
When you send the output to grep, add 2>&1 before the pipe, as in the examples below. Otherwise grep does not read the error output of the container, and you can miss lines. docker logs also works for a container that is stopped.
How do I find a session in the logs?
Symptoms: The container log mixes all sessions, and you need only the lines for one session.
Resolution: Narrow the log by time or by session ID.
-
By time: use -t and --since to find the lines at the time that the user reported.
-
By session ID: each session has an ID of 24 characters. The same ID appears in vo-web (SESSIONID), in the name of the recording file in vo-core, and in vo-sync. With this ID, you can follow one session across the containers.
What do common messages mean in vo-core?
Symptoms: You are reading vo-core logs and need to tell normal session flow from messages that need attention.
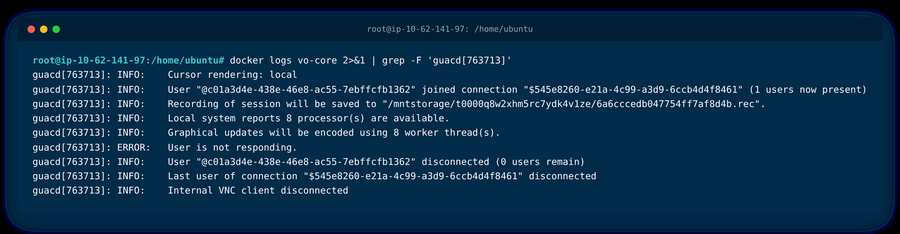
Resolution: Every line starts with guacd[number]. The number identifies one session: all the lines with the same number belong to the same session, from the start to the end. The lines with guacd[1] belong to the main process, which creates and removes the connections, and they show the protocol, for example Creating new client for protocol "ssh". Web Shield sessions use the protocol vnc.
Use grep -F with the number of the session. The option -F reads the brackets as text:
docker logs vo-core 2>&1 | grep -F 'guacd[763713]'
-
INFO: the normal flow of the session.
-
WARNING: these messages also appear in healthy sessions, and you can ignore them:
- No known host keys provided, host identity will not be verified.
- Unable to set the timezone: SSH server refused to set "TZ" variable.
- Ignoring requested color depth of 24 bpp, as the RDP Graphics Pipeline requires 32 bpp.
-
ERROR User is not responding.: the browser of the user stopped answering the Jump Server, for example because the tab was closed or the connection between the user and the Jump Server was interrupted. The target is not involved.
-
Messages that say the server closed or refused the connection: the target ended the connection. These lines usually point to the cause.
For example, this line shows an RDP connection that the server refused:
guacd[2923101]: INFO: RDP server closed/refused connection: Security negotiation failed (wrong security type?)
This suggests that the security mode configured for the resource in PAM, for example TLS, is different from the one that the Windows server requires, for example NLA. It is a strong lead, but not a confirmed diagnosis. Compare the security mode of the resource with the requirements of the target machine before you decide the cause.
What do common messages mean in vo-web?
Symptoms: You are reading vo-web logs for a Web Shield or DB Shield session and need to interpret the session sequence.
Resolution: Each Web Shield or DB Shield session follows the same sequence. Use the name that appears in brackets to see all its lines:
docker logs vo-web 2>&1 | grep -F 'Firewall-Console-fc70ebc0'

-
The sequence is: scheduling the container, starting the container, WebShield is connectable, container created, user connected, connection ended.
-
If the sequence stops before container created, the container of the session did not start. If the image is not on the host yet, the Jump Server downloads it from public.ecr.aws, so a problem here can point to the outbound access.
-
Duration at the end of the session shows how long the session was open, in milliseconds.
-
IllegalStateException: Message will not be sent because the WebSocket session has been closed and the long list of lines after it also appear in healthy sessions, when the browser closes. Ignore it unless it is the only problem that you find.
What do common messages mean in vo-bastion?
Symptoms: You are reading vo-bastion logs for Direct Access or SSH or RDP tunnel issues and need to know which lines to ignore.
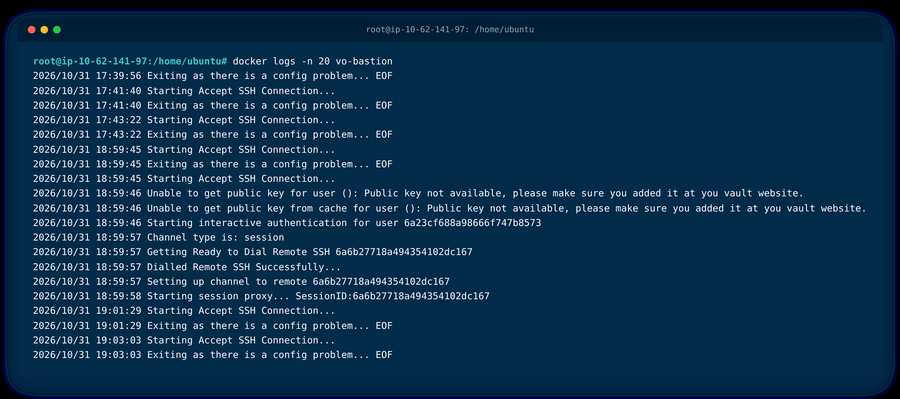
Resolution: Show only the last lines first, so that the log is easier to read:
docker logs -n 20 vo-bastion
-
Starting Accept SSH Connection... followed by Exiting as there is a config problem... EOF repeats about every 2 minutes, even when nobody is connected. Ignore these lines.
-
Unable to get public key for user is not an error. The user did not register a public key, so Direct Access asks to approve the login in the browser.
-
Starting interactive authentication for user shows the start of the login of the user.
-
The sequence of an SSH session is: Channel type is: session, Getting Ready to Dial Remote SSH, Dialled Remote SSH Successfully..., Setting up channel to remote, and Starting session proxy....
-
If the sequence stops before Dialled Remote SSH Successfully..., the Jump Server did not reach the target. Test the connection from the host of the Jump Server to the address and the port of the target.
-
In RDP Direct Access, the user is VOProtocolHandler and the channel is direct-tcpip. This is the RDP Connector on the computer of the user, which opens the tunnel for the RDP client.
What do common messages mean in vo-sync?
Symptoms: You are reading vo-sync logs to confirm Jump Server healthchecks, queue listener status, or session recording upload.
Resolution: The lines of vo-sync repeat on a schedule. In a healthy Jump Server, you see these lines:
[2026-10-31T19:00:00Z] INFO: validating queue listener\ [2026-10-31T19:00:00Z] INFO: queue listener is running\ [2026-10-31T19:00:21Z] INFO: healthcheck sent to PAM\ time=2026-10-31T18:55:00.935Z level=INFO msg="Synchronizing backup logs" folder=/backup/logs
-
healthcheck sent to PAM appears about every 5 minutes. If it stops, check the connection from the Jump Server to the PAM Backend.
-
queue listener is running appears about every 10 minutes. It confirms that the Jump Server can receive live commands, such as disconnecting a user. If the line is missing, test the outbound access on port 5671.
To confirm that the recording of a session was uploaded, search for the ID of the session:
docker logs vo-sync 2>&1 | grep -F '6ae5ce8127bb3e297f900328'

-
A recording that is on the host but never appears in the portal is an upload problem. Check the free disk space on the host and the outbound access to the storage addresses.
-
Database sessions also upload a .json file with the text log of the queries. With DB Shield, they also upload the .rec video.
What do common messages mean in vo-database?
Symptoms: The vo-database log is long, and Java stack traces make it hard to find useful lines.
Resolution: Hide the stack trace lines that start with at or ...:
\ docker logs vo-database 2>&1 | grep -v -E '^\s+at |^\s+\\\\\\'
-
Project created: [ID=g_GlobalConfiguration... is a normal message when a database session starts.
-
No web session found for websocket request with the path /database/api/ws means that the database client tried to open a connection without a valid web session. By itself, it does not mean that the connection to the database failed. If it appears at the same time as the problem, include it in the logs that you send to JumpCloud Support.
-
Some data source listeners are still registered is a periodic message of the session monitor, and it is not related to one user.
How do I collect the installation logs?
Symptoms: The installation of the Jump Server failed, finished with warnings, or finished but the Jump Server does not work as expected, for example the status is not Online or users see a browser warning when they open the Jump Server address.
Resolution: The installer saves a log of every step in a file on the host. Find the file and read it.
- Open a terminal on the host of the Jump Server and switch to the root user:
sudo su

2.
Find the path of the log. At the end of the installation, the installer shows it in the line All logs are available in. The name of the file has the date and the time when the installation started. If you no longer have the message, list the files and use the most recent one:
ls -lt /tmp/jumpcloud-vault/

3.
Show the complete log:
cat /tmp/jumpcloud-vault/install-\<date>-\<time>.log
Each installation or update creates a new file, so the file of the installation that failed can be an older one. The times in the lines of the log are in UTC. When you contact JumpCloud Support, send the complete file, not only the lines with errors.
Was this information helpful?