Review and Resolve Detections
The Detections page displays a comprehensive list of all identified detections across your org.
To view the Detections page:
- Login to the JumpCloud Admin Portal.
If your data is stored outside of the US, check which login URL you should be using depending on your region. If your organization uses LDAP, RADIUS, or requires firewall allow list configuration, the Fully Qualified Domain Names (FQDNs) will also be region specific. See JumpCloud Data Centers for the URLs, FQDNs, and IP addresses.
-
Go to Monitoring > Access Risk.
-
Click the Detections tab to view the detections page.
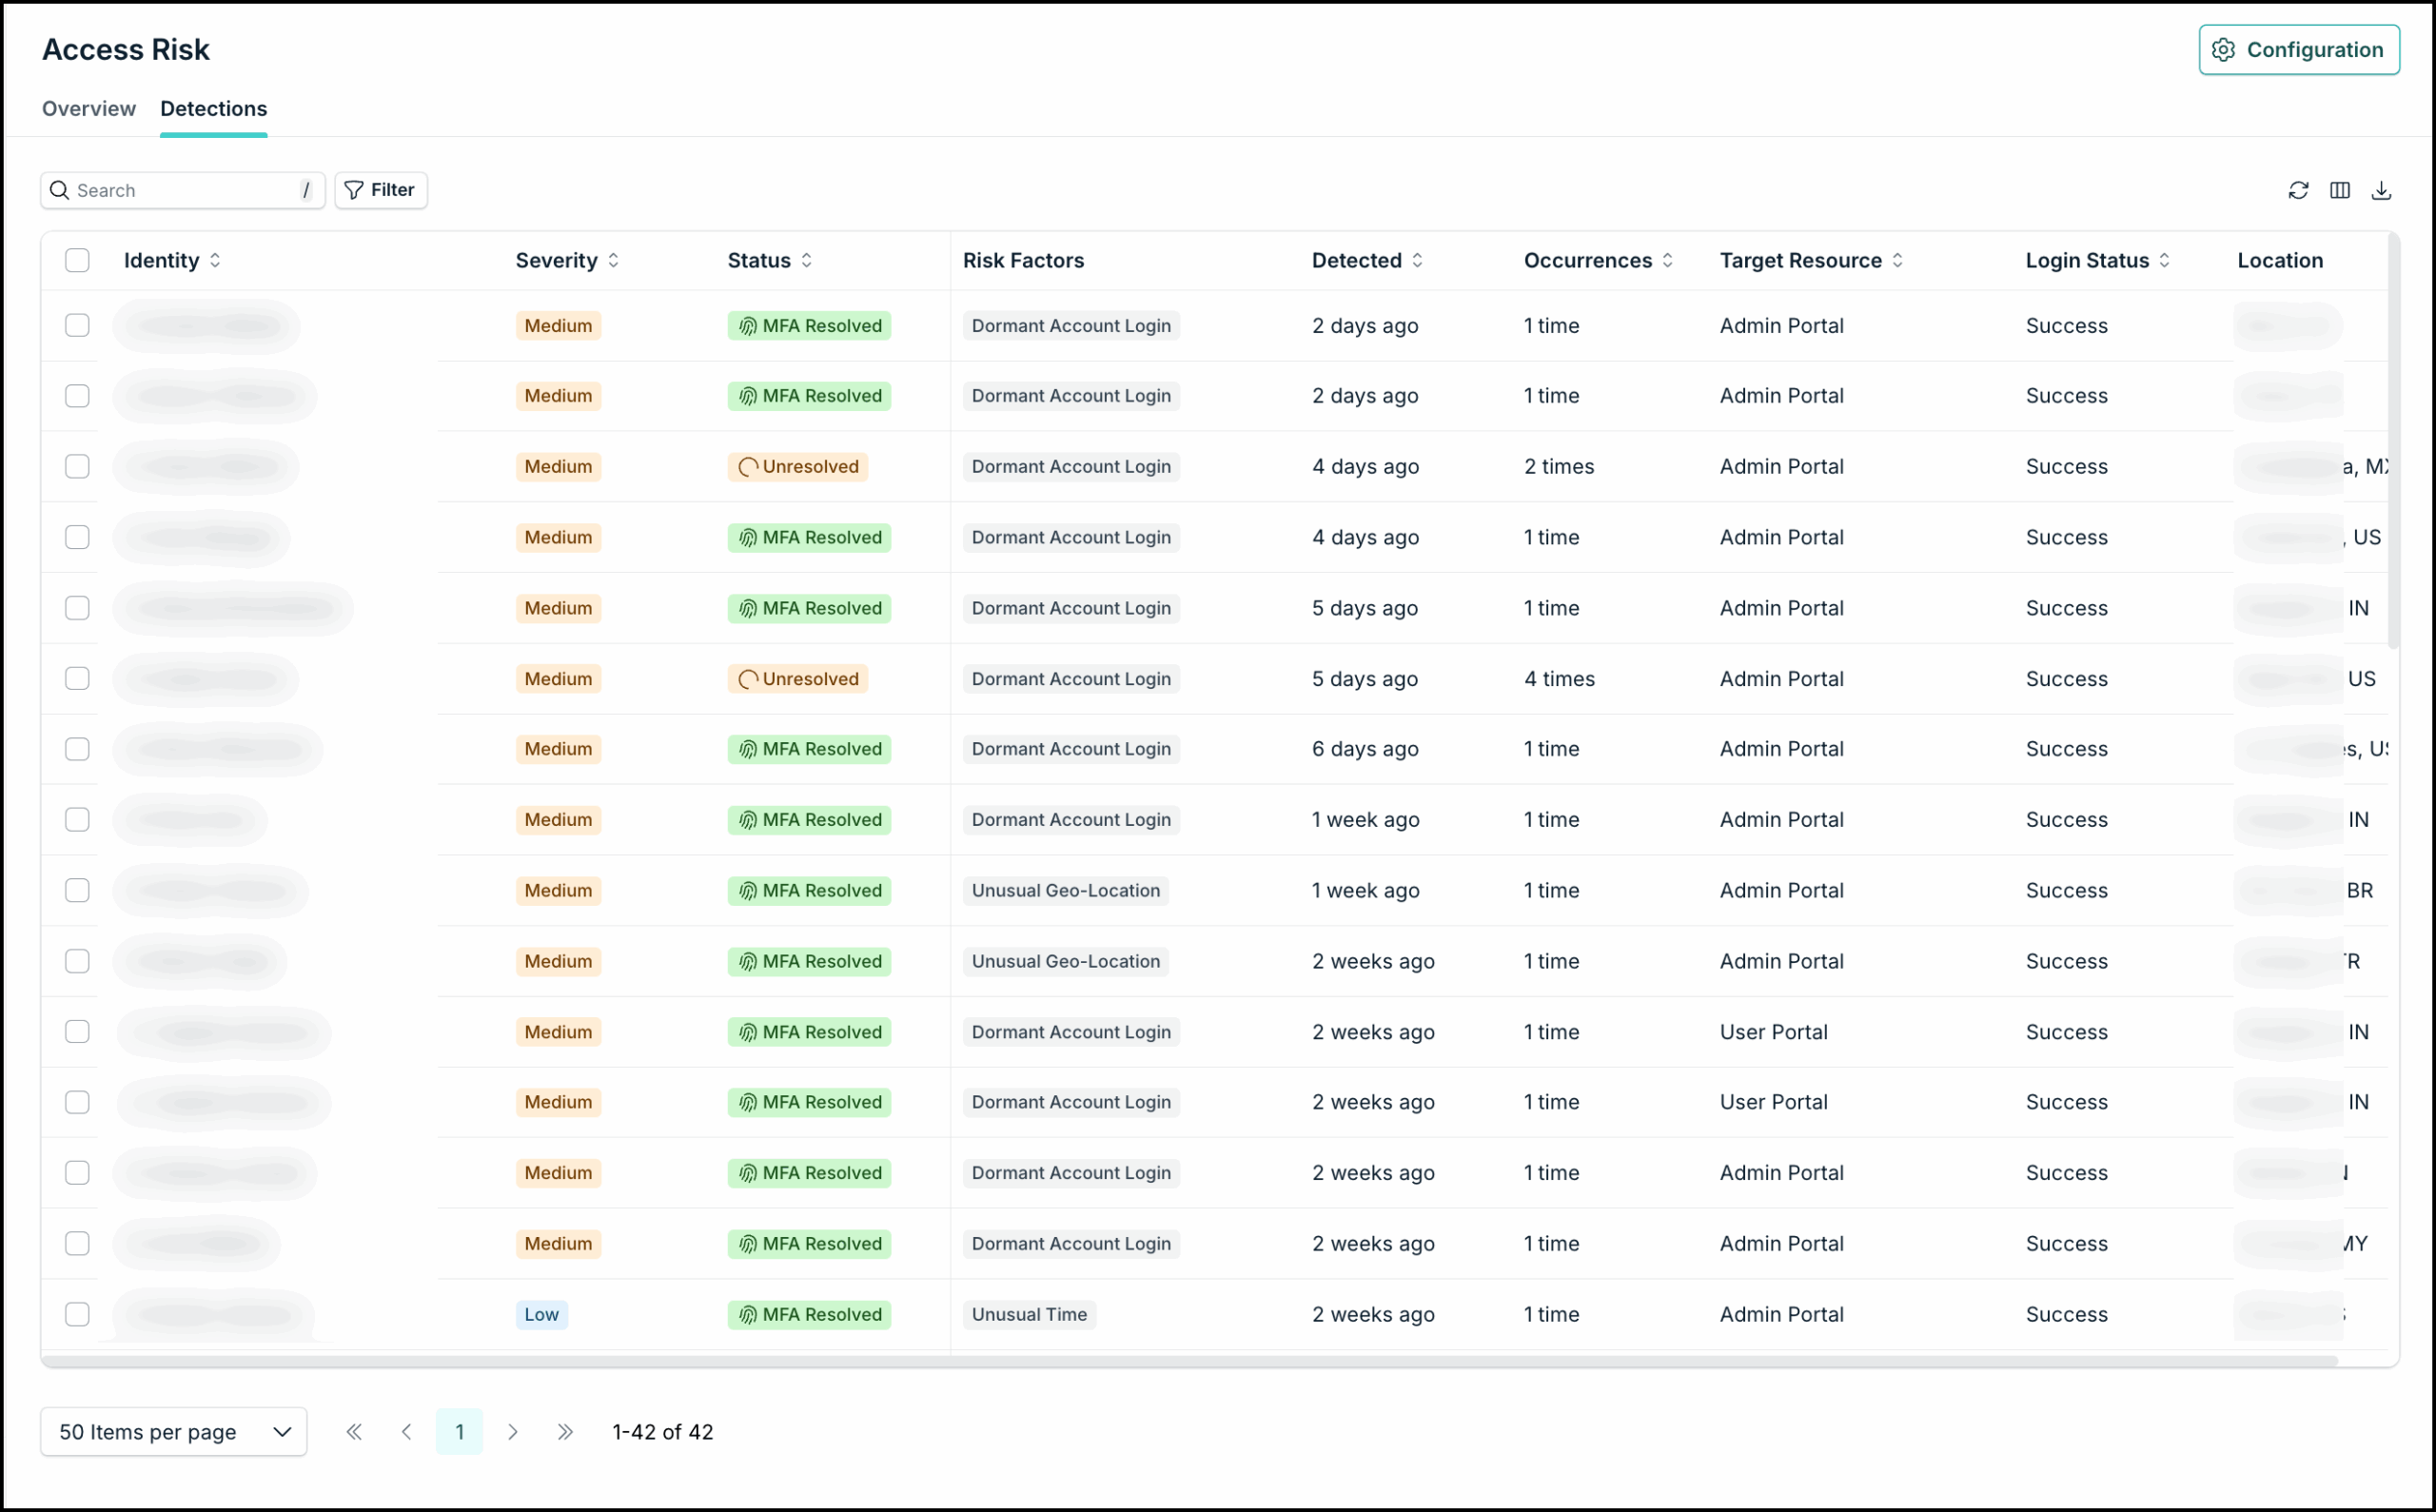
The Detections page lists every flagged login event in your org. Each row represents a single detection and includes:
- Identity — the user associated with the login
- Severity — Low, Medium, or Critical
- Status — Unresolved, Resolved-Safe, Resolved-Not Safe, or MFA Resolved
- Risk Factor — which signals fired
- Occurrences — how many times this pattern has been seen for this user
- Login Resource — the type of login (User Portal, Admin Portal, SSO, or Device)
- Login Status — whether the underlying login succeeded or failed
- Detected - When the event last occurred.
You will see two tabs:
- Needs Review: Contains all unresolved detections that require action. Auto-resolved detections are filtered out to eliminate noise and help you focus on what matters.
- All Detections: Displays every detection in the system, regardless of status.
Using Filters
You can use the filter options in the Detections page to set up your preferred filters so you can view what matters most.
Here are some common filter strategies:
- Severity: Critical — to focus on the highest-priority detections first
- Status: Unresolved — to see what still needs review
- Identity: Specific user — to see all detections for a user you are investigating
- Login Resource: Admin Portal — to scrutinize privileged account activity separately
Saving a Filter View
The Detections dashboard allows you to filter and customize how you monitor access risks. To save time and quickly access the specific data breakdowns you use most frequently, you can save your custom configurations using the Save view feature.
To create a custom view:
- Use the search bar or the Filter button to narrow down your detections (for example: set Status is Unresolved and Severity is Medium).
- Click the Save view button.
- In the pop-up modal, give your view a descriptive name (like "Medium Severity Unresolved") so you can easily identify it later.
You can also select a previously saved view.
- Click Select View next to the Search bar and select the desired view from the dropdown.
Investigating a Detection
On the Detections page, click any detection in the list to open the Detection Detail view. This Details page provides the full context you need to make an informed decision.
What you see:
- Risk Factor Deviations: For each detected factor, exactly what was unusual about this login relative to the user's history
- User Profile: A summary of the typical behavior Access Risk has learned for this user, including typical locations, devices, and times
- Risk Detection History: A timeline of previous detections for the same user, so you can tell whether this is part of a pattern
Consider asking these questions while investigating a detection:
- Does the login location match anywhere the user might reasonably be right now?
- Is the device one they have used before, or genuinely new?
- Has the user had similar detections recently, or is this an isolated event?
- Did the login ultimately succeed or fail? A failed login from a new location is a different story than a successful one.
- Is there any scheduled activity — travel, a planned late shift — that would explain this?
Viewing Detection Activity Logs
To gain deeper visibility into a specific alert, click the Activity Log link located within either the Access Event Details pane or the Detection History section. This will take you to the Directory Insights page that provides an audit trail of the raw event sequence leading up to the detection over the last 24 hours.
Resolving a Detection
Once you have investigated, you can close the detection by marking it as safe or confirming the risk.
To close the detection, click Resolve.
- Mark as Not a Risk
Choose this when the login is legitimate and the pattern is expected. The detection moves to Resolved-Safe status. Marking events as safe contributes to improving the user's baseline over time, so future similar events are less likely to trigger detections. - Flag as Risk
Choose this when you think the login might be at risk but needs to be reviewed. - Confirm Risk
Choose this when you believe the detection represents a genuine security concern. The detection moves to Resolved-Not Safe status. This action does not automatically remediate the threat — you still need to take separate action such as resetting the user's password, suspending the account, or contacting the user.
Marking a detection as Resolved-Not Safe records your assessment but does not take any security action. You must take separate action through Conditional Access Policies, password reset, or account suspension.
Bulk resolution
If you have multiple detections that share the same resolution, you can resolve them in bulk. All the selected risk will be resolved with same status and comment that you provide.
On the detections page, select the detections that you want to resolve and click Resolve on the floating bar.
Resolving Detections from Notifications
If you have configured notification channels for Access Risk Detection, you will be notified whenever a risk is detected.
Email
If you configured email notification channels, all users in the channels will be notified. From the email, you can click the View Detection button to navigate to the Access Risk section of the JumpCloud admin portal and view the detection details.
Slack
If you configured Slack channels, your selected Slack channels will be notified in real-time. You can resolve detections directly from Slack without logging into the admin portal.
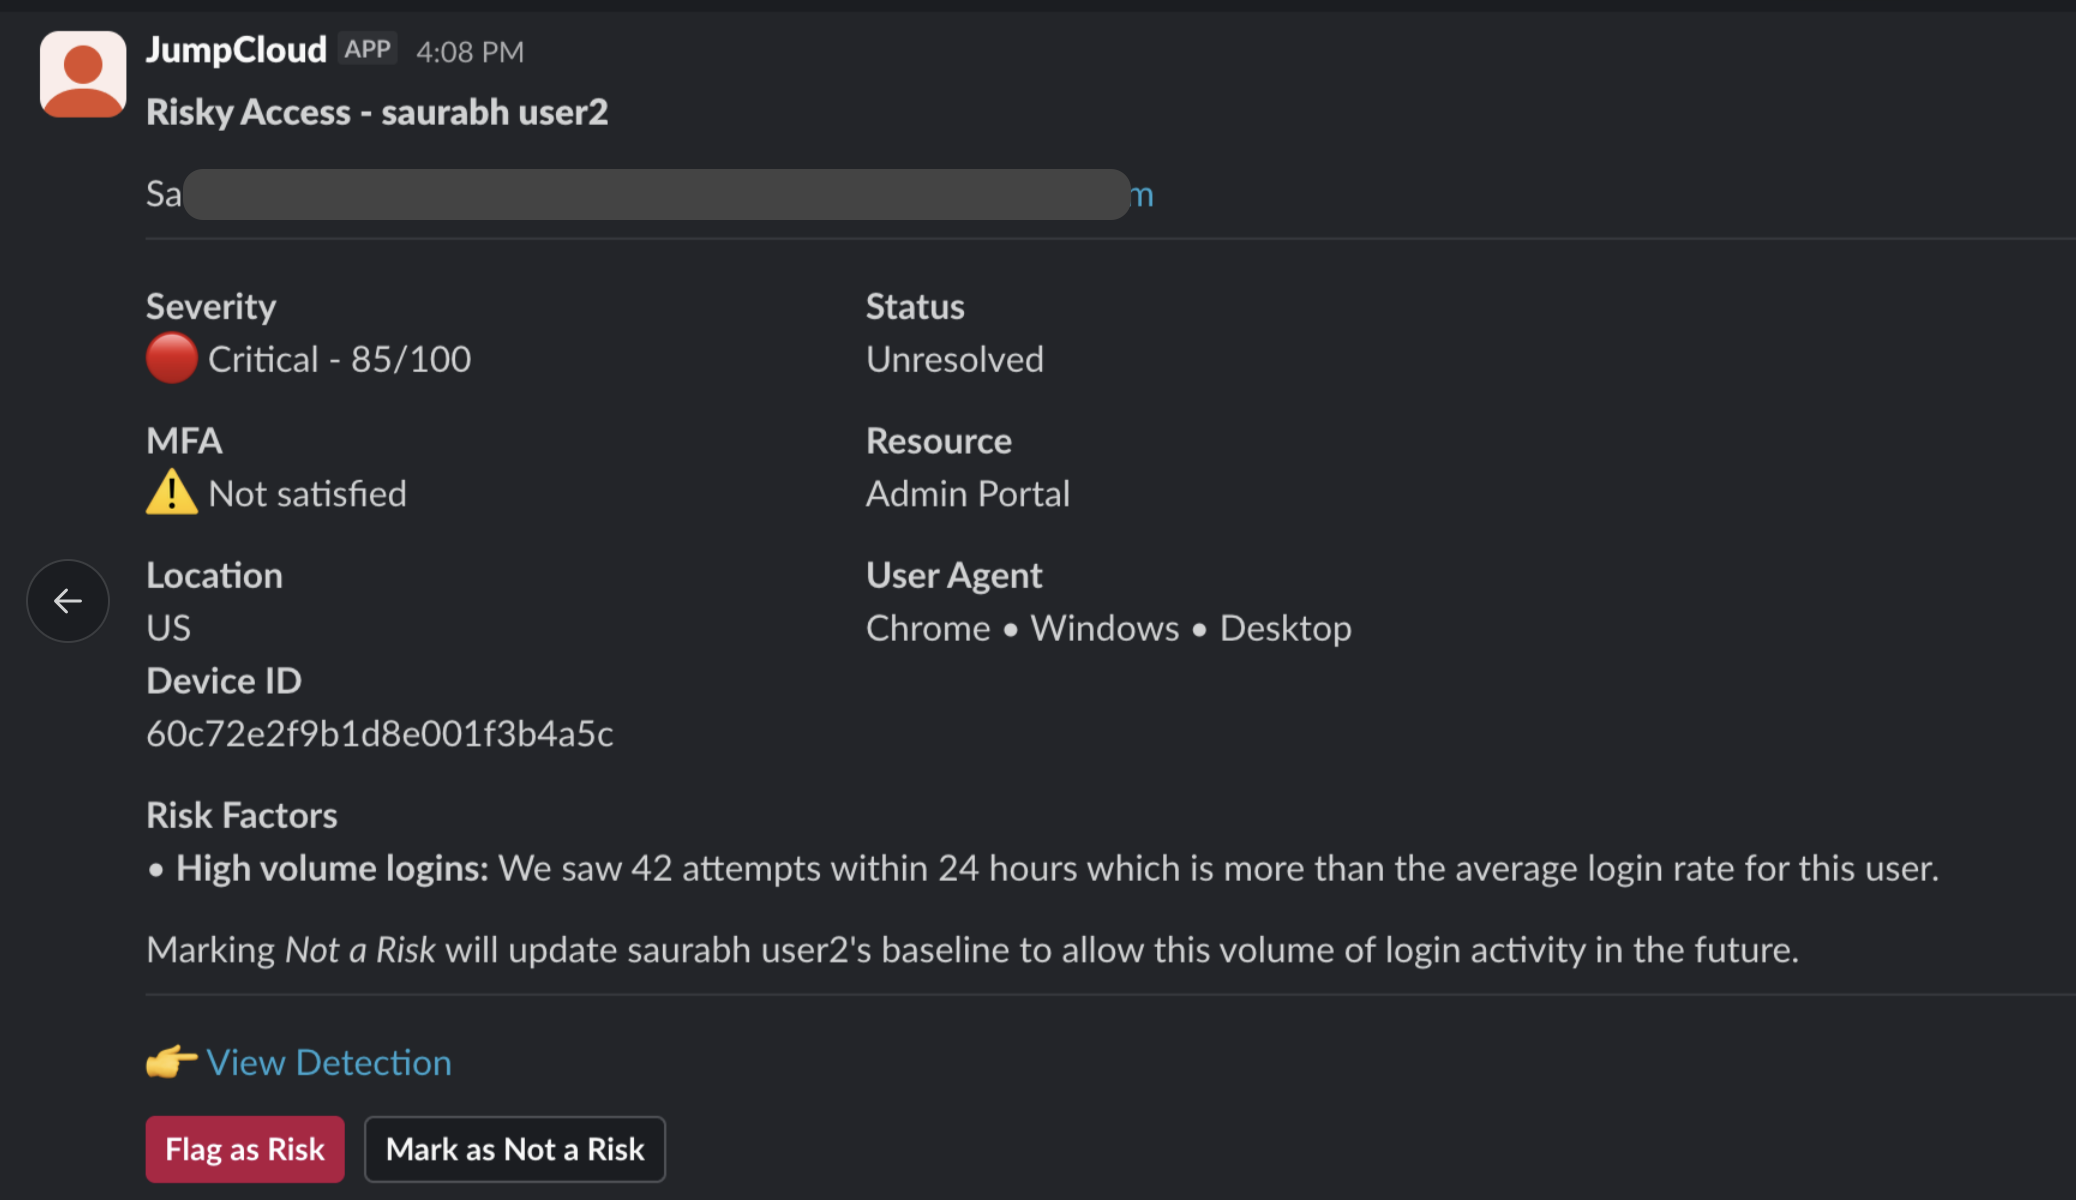
To resolve detections directly from Slack:
- Click the View Detection link to view the detection details in the Access Risk section.
- You can also directly resolve the detection from Slack.
- Flag as Risk: Click this when you think the login might be at risk but needs to be reviewed.
- Mark as Not a Risk: Click this when the login is legitimate and the pattern is expected. The detection moves to Resolved-Safe status. Marking events as safe contributes to improving the user's baseline over time, so future similar events are less likely to trigger detections.
Once you select the resolution option, your response will be recorded and the detection status will be updated in the Access Risk Detection section.
Automatic resolution via MFA
If you have enabled MFA auto-resolution, detections where MFA was successfully completed are automatically moved to MFA Resolved status. These detections do not require manual review. You can still open them to inspect the details if you want to understand what was flagged.
Recommended review cadence:
- Critical: review immediately as notifications arrive
- Medium: review at least once per day
- Low: review weekly, or rely on MFA auto-resolution to close them
Was this information helpful?